

Question: Answer all questions Use the historical data and template provided to create a model for the analysis of 2-securities portfolio. 1. Create 'drop down' menu
 Answer all questions
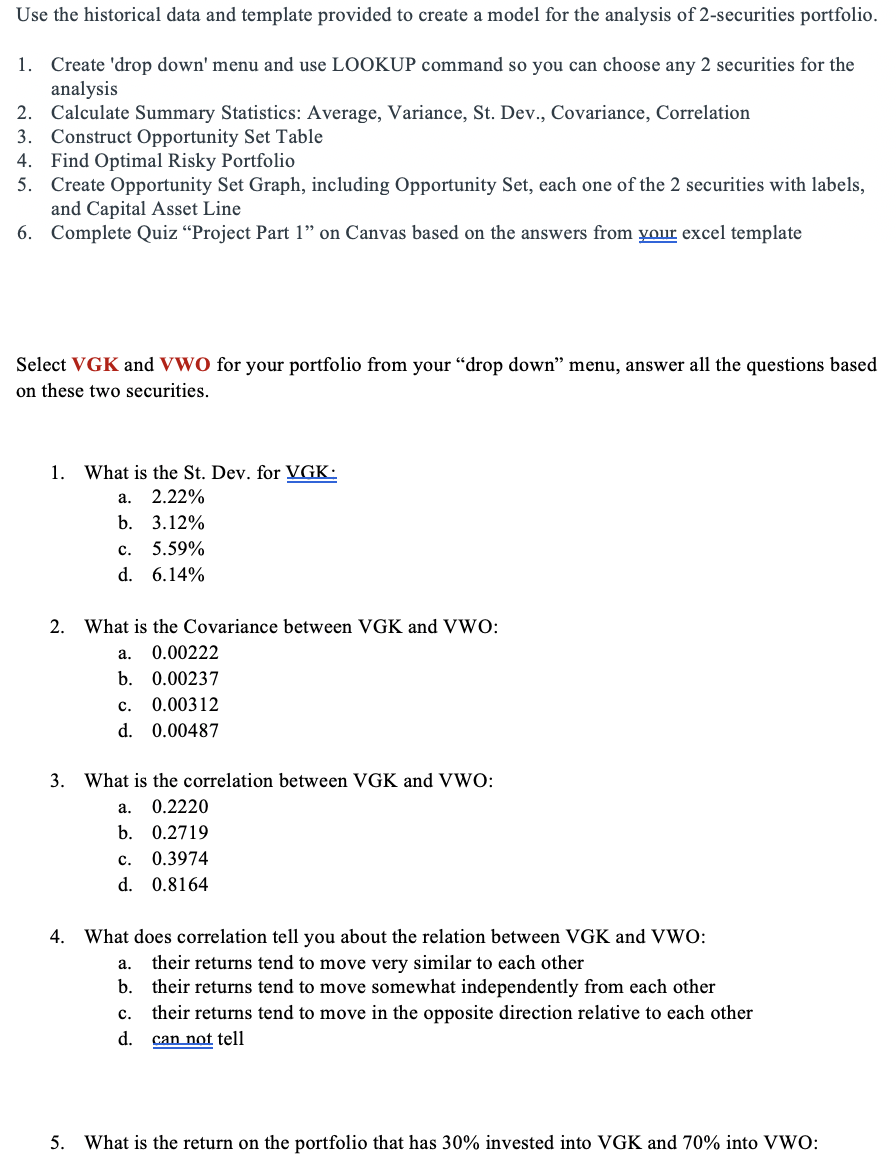
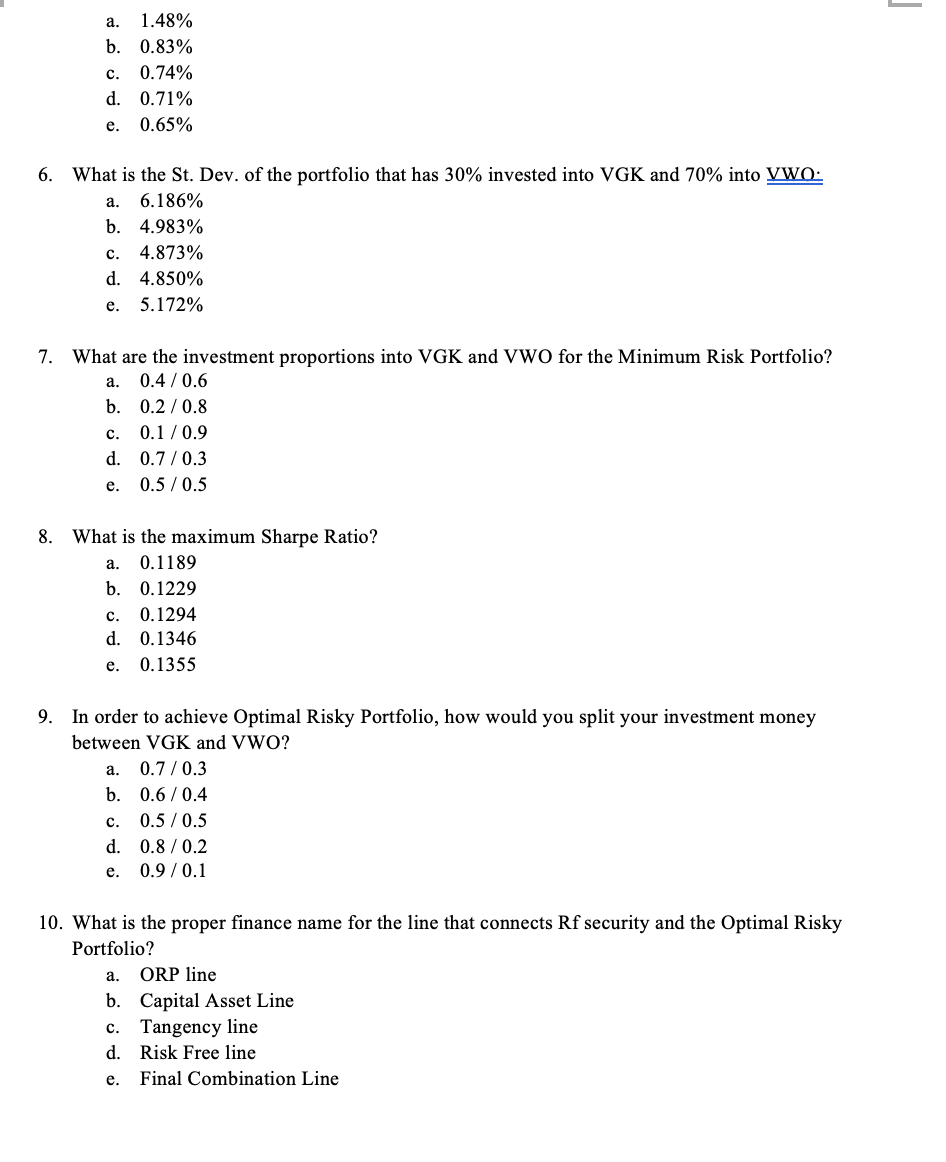
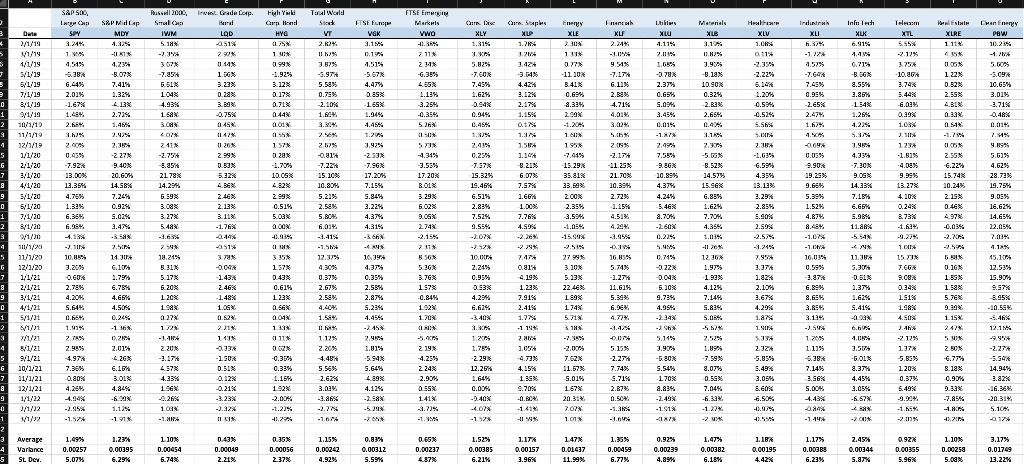
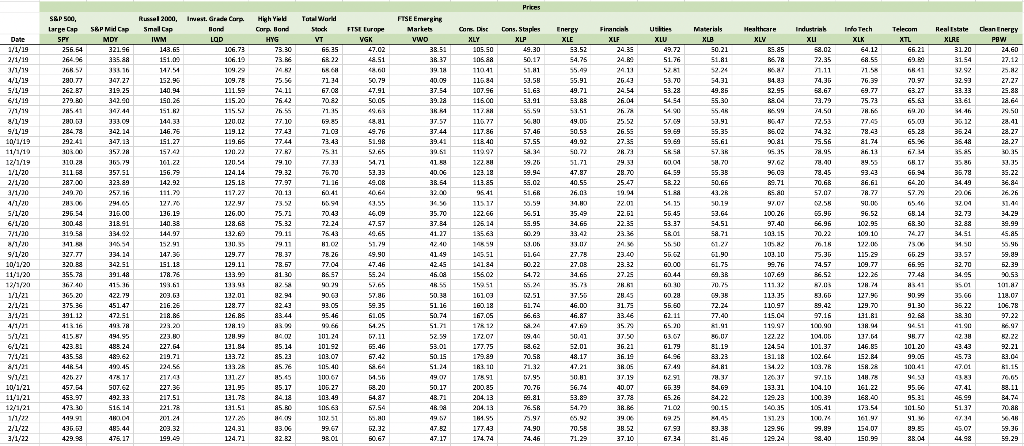
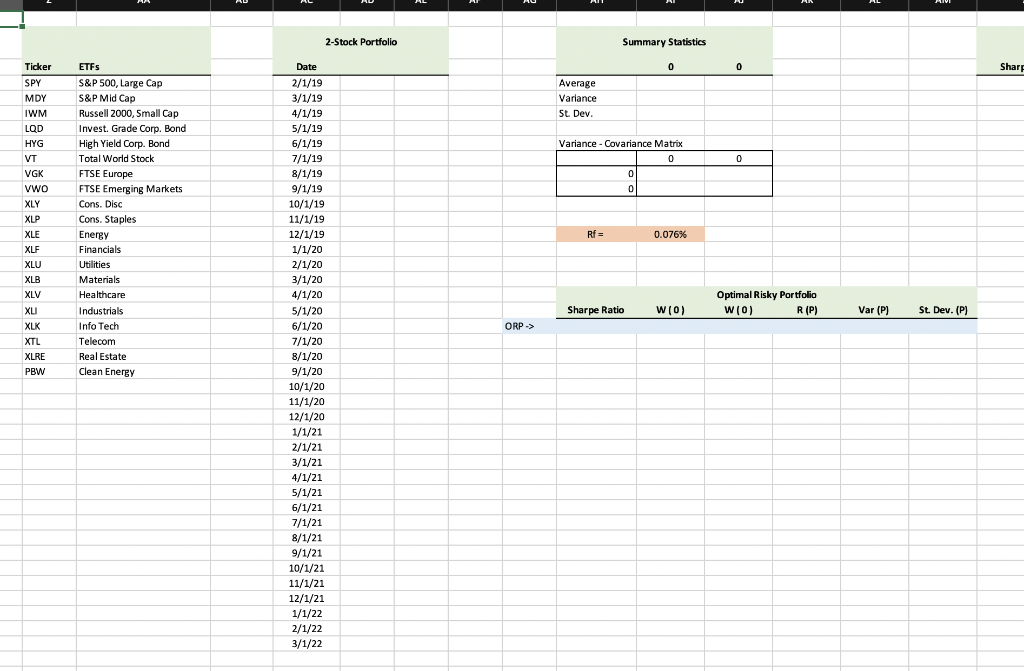
Use the historical data and template provided to create a model for the analysis of 2-securities portfolio. 1. Create 'drop down' menu and use LOOKUP command so you can choose any 2 securities for the analysis 2. Calculate Summary Statistics: Average, Variance, St. Dev., Covariance, Correlation 3. Construct Opportunity Set Table 4. Find Optimal Risky Portfolio 5. Create Opportunity Set Graph, including Opportunity Set, each one of the 2 securities with labels, and Capital Asset Line 6. Complete Quiz Project Part 1" on Canvas based on the answers from your excel template Select VGK and Vwo for your portfolio from your "drop down menu, answer all the questions based on these two securities. 1. What is the St. Dev. for VGK: a. 2.22% b. 3.12% C. 5.59% d. 6.14% 2. What is the Covariance between VGK and VWO: a. 0.00222 b. 0.00237 c. 0.00312 d. 0.00487 a. 3. What is the correlation between VGK and VWO: 0.2220 b. 0.2719 c. 0.3974 d. 0.8164 a. 4. What does correlation tell you about the relation between VGK and VWO: their returns tend to move very similar to each other b. their returns tend to move somewhat independently from each other their returns tend to move in the opposite direction relative to each other d. can not tell c. 5. What is the return on the portfolio that has 30% invested into VGK and 70% into VWO: - a. 1.48% b. 0.83% c. 0.74% d. 0.71% e. 0.65% 6. What is the St. Dev. of the portfolio that has 30% invested into VGK and 70% into VWO- a. 6.186% b. 4.983% c. 4.873% d. 4.850% e. 5.172% a. 7. What are the investment proportions into VGK and VWO for the Minimum Risk Portfolio? 0.4 / 0.6 b. 0.2 / 0.8 c. 0.1/0.9 d. 0.7 / 0.3 e. 0.5 / 0.5 8. What is the maximum Sharpe Ratio? a. 0.1189 b. 0.1229 c. 0.1294 d. 0.1346 e. 0.1355 9. In order to achieve Optimal Risky Portfolio, how would you split your investment money between VGK and VWO? a. 0.7 / 0.3 b. 0.6/0.4 c. 0.5 / 0.5 d. 0.8 / 0.2 0.9 / 0.1 e. 10. What is the proper finance name for the line that connects Rf security and the Optimal Risky Portfolio? a. ORP line b. Capital Asset Line c. Tangency line d. Risk Free line Final Combination Line e. WORDEN AGAMA SK PEPPERO NON SPEED M ES BE 99 SNAN 1 PL EEN B EN NW PM KAN N4 ; go BNN 19 78 DOWE SERBANE = 5; i aa83a38aass ggage : $ MEN SENESNESENS ERASERHAN gsgg32:::a=%9: 89SSSNS 8X8 Ma Nyin ;; : G a: 22 ERNESBB SENSASSERRES SRPS PSR 238 =d38e5a2a 592yyxs99 3 : ,:: ; | BAB 888RIA SB8%BARBA ME HRABRONRG BERLEB&BURAN :B 839 2 ,ss 5 AD NE 2-Stock Portfolio Summary Statistics 0 0 Share Average Variance St. Dev. Ticker SPY MDY IWM LQD HYG VT VGK VWO XLY XLP Variance - Covariance Matrix 0 0 0 0 0 ETFS S&P 500, Large Cap S&P Mid Cap Russell 2000, Small Cap Invest. Grade Corp. Bond High Yield Corp. Bond Total World Stock FTSE Europe FTSE Emerging Markets Cons. Disc Cons. Staples Energy Financials Utilities Materials Healthcare Industrials Info Tech Telecom Real Estate Clean Energy Rf= 0.076% XLE XLF XLU XLB XLV Optimal Risky Portfolio W10) R (P) Sharpe Ratio W(0) Var (P) St. Dev. (P) XLI XLK XTL ORP -> XLRE PBW Date 2/1/19 3/1/19 4/1/19 5/1/19 6/1/19 7/1/19 8/1/19 9/1/19 10/1/19 11/1/19 12/1/19 1/1/20 2/1/20 3/1/20 4/1/20 5/1/20 6/1/20 7/1/20 8/1/20 9/1/20 10/1/20 11/1/20 12/1/20 1/1/21 2/1/21 3/1/21 4/1/21 5/1/21 6/1/21 7/1/21 8/1/21 9/1/21 10/1/21 11/1/21 12/1/21 1/1/22 2/1/22 3/1/22 Use the historical data and template provided to create a model for the analysis of 2-securities portfolio. 1. Create 'drop down' menu and use LOOKUP command so you can choose any 2 securities for the analysis 2. Calculate Summary Statistics: Average, Variance, St. Dev., Covariance, Correlation 3. Construct Opportunity Set Table 4. Find Optimal Risky Portfolio 5. Create Opportunity Set Graph, including Opportunity Set, each one of the 2 securities with labels, and Capital Asset Line 6. Complete Quiz Project Part 1" on Canvas based on the answers from your excel template Select VGK and Vwo for your portfolio from your "drop down menu, answer all the questions based on these two securities. 1. What is the St. Dev. for VGK: a. 2.22% b. 3.12% C. 5.59% d. 6.14% 2. What is the Covariance between VGK and VWO: a. 0.00222 b. 0.00237 c. 0.00312 d. 0.00487 a. 3. What is the correlation between VGK and VWO: 0.2220 b. 0.2719 c. 0.3974 d. 0.8164 a. 4. What does correlation tell you about the relation between VGK and VWO: their returns tend to move very similar to each other b. their returns tend to move somewhat independently from each other their returns tend to move in the opposite direction relative to each other d. can not tell c. 5. What is the return on the portfolio that has 30% invested into VGK and 70% into VWO: - a. 1.48% b. 0.83% c. 0.74% d. 0.71% e. 0.65% 6. What is the St. Dev. of the portfolio that has 30% invested into VGK and 70% into VWO- a. 6.186% b. 4.983% c. 4.873% d. 4.850% e. 5.172% a. 7. What are the investment proportions into VGK and VWO for the Minimum Risk Portfolio? 0.4 / 0.6 b. 0.2 / 0.8 c. 0.1/0.9 d. 0.7 / 0.3 e. 0.5 / 0.5 8. What is the maximum Sharpe Ratio? a. 0.1189 b. 0.1229 c. 0.1294 d. 0.1346 e. 0.1355 9. In order to achieve Optimal Risky Portfolio, how would you split your investment money between VGK and VWO? a. 0.7 / 0.3 b. 0.6/0.4 c. 0.5 / 0.5 d. 0.8 / 0.2 0.9 / 0.1 e. 10. What is the proper finance name for the line that connects Rf security and the Optimal Risky Portfolio? a. ORP line b. Capital Asset Line c. Tangency line d. Risk Free line Final Combination Line e. WORDEN AGAMA SK PEPPERO NON SPEED M ES BE 99 SNAN 1 PL EEN B EN NW PM KAN N4 ; go BNN 19 78 DOWE SERBANE = 5; i aa83a38aass ggage : $ MEN SENESNESENS ERASERHAN gsgg32:::a=%9: 89SSSNS 8X8 Ma Nyin ;; : G a: 22 ERNESBB SENSASSERRES SRPS PSR 238 =d38e5a2a 592yyxs99 3 : ,:: ; | BAB 888RIA SB8%BARBA ME HRABRONRG BERLEB&BURAN :B 839 2 ,ss 5 AD NE 2-Stock Portfolio Summary Statistics 0 0 Share Average Variance St. Dev. Ticker SPY MDY IWM LQD HYG VT VGK VWO XLY XLP Variance - Covariance Matrix 0 0 0 0 0 ETFS S&P 500, Large Cap S&P Mid Cap Russell 2000, Small Cap Invest. Grade Corp. Bond High Yield Corp. Bond Total World Stock FTSE Europe FTSE Emerging Markets Cons. Disc Cons. Staples Energy Financials Utilities Materials Healthcare Industrials Info Tech Telecom Real Estate Clean Energy Rf= 0.076% XLE XLF XLU XLB XLV Optimal Risky Portfolio W10) R (P) Sharpe Ratio W(0) Var (P) St. Dev. (P) XLI XLK XTL ORP -> XLRE PBW Date 2/1/19 3/1/19 4/1/19 5/1/19 6/1/19 7/1/19 8/1/19 9/1/19 10/1/19 11/1/19 12/1/19 1/1/20 2/1/20 3/1/20 4/1/20 5/1/20 6/1/20 7/1/20 8/1/20 9/1/20 10/1/20 11/1/20 12/1/20 1/1/21 2/1/21 3/1/21 4/1/21 5/1/21 6/1/21 7/1/21 8/1/21 9/1/21 10/1/21 11/1/21 12/1/21 1/1/22 2/1/22 3/1/22
Step by Step Solution
There are 3 Steps involved in it

Get step-by-step solutions from verified subject matter experts