

Question: Use the historical data and template provided to create a model for the analysis of 2-securities portfolio. 1. Create 'drop down' menu and use LOOKUP
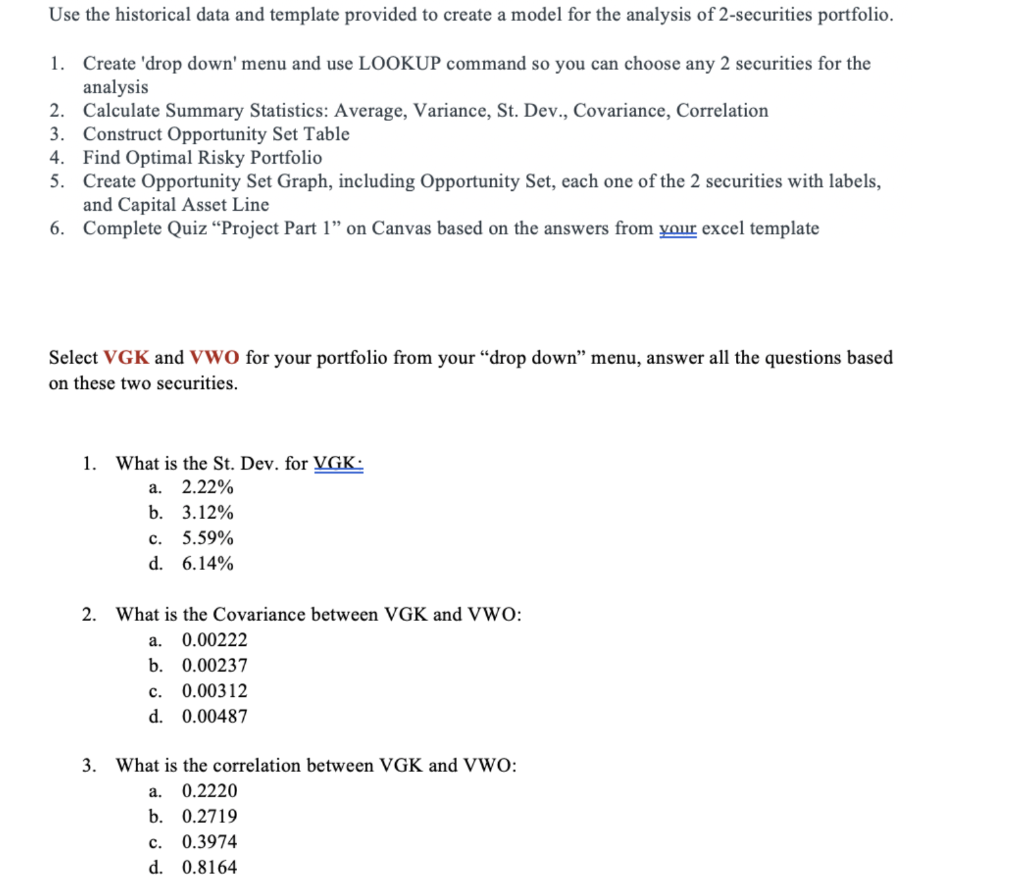
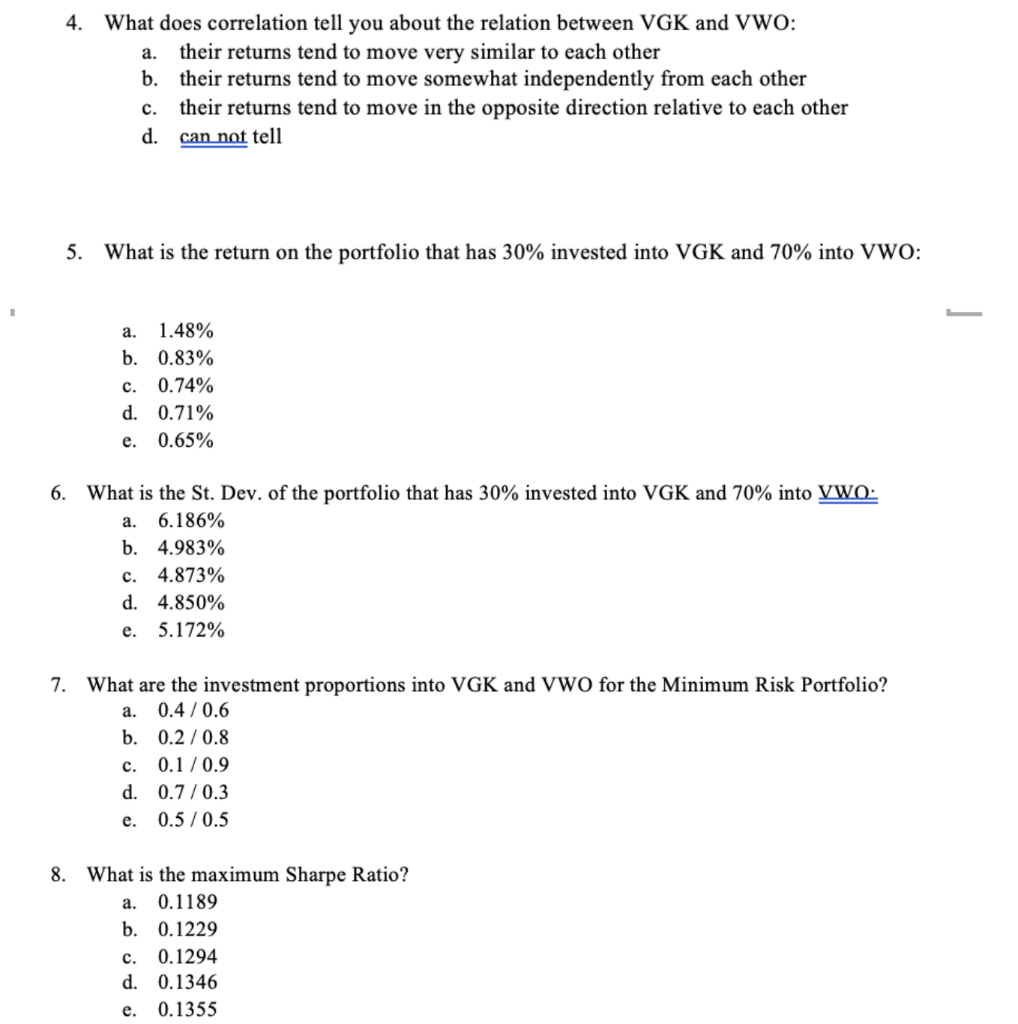
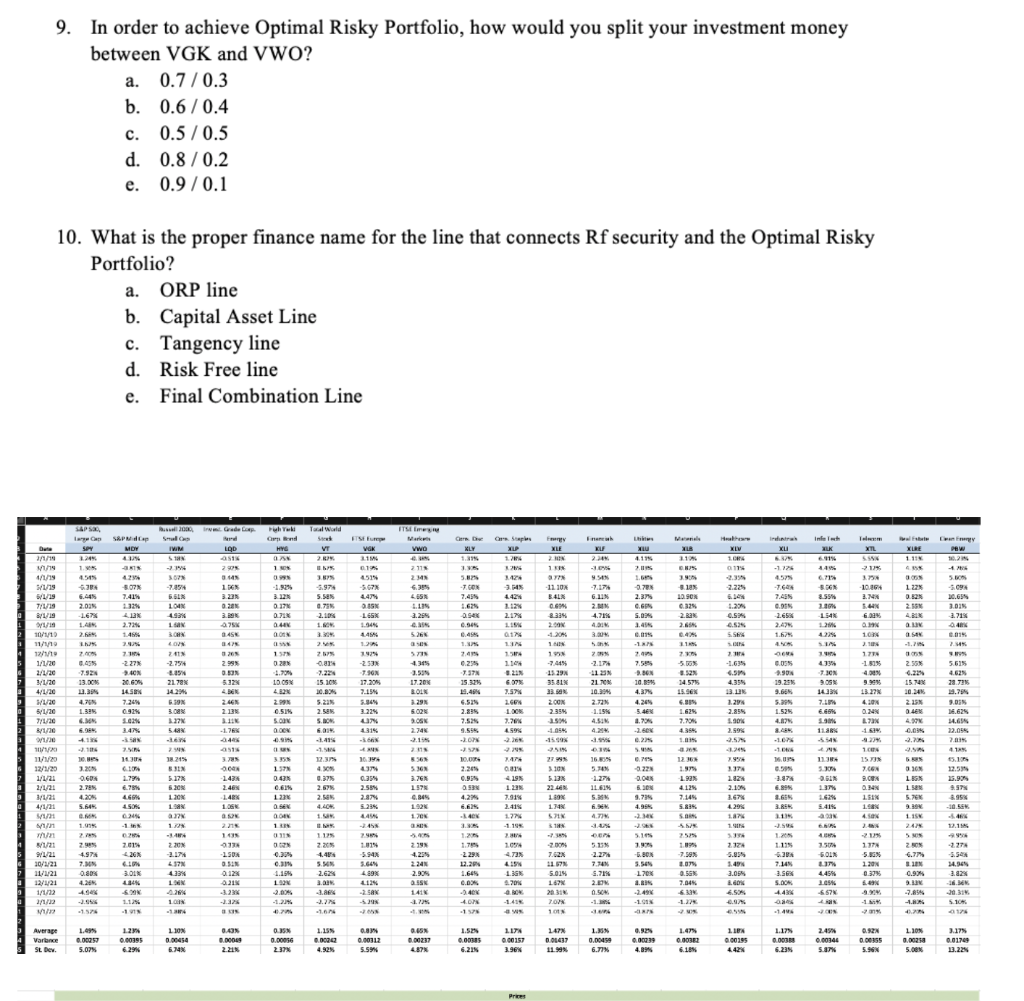
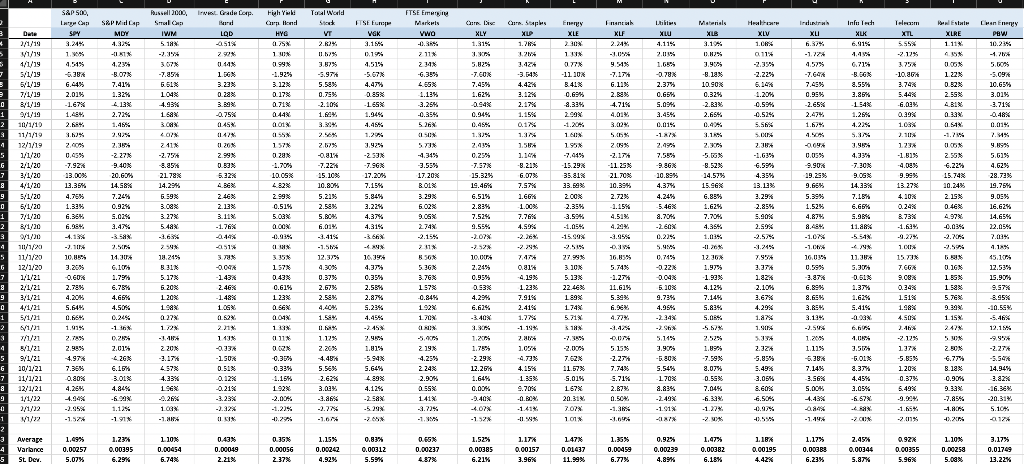
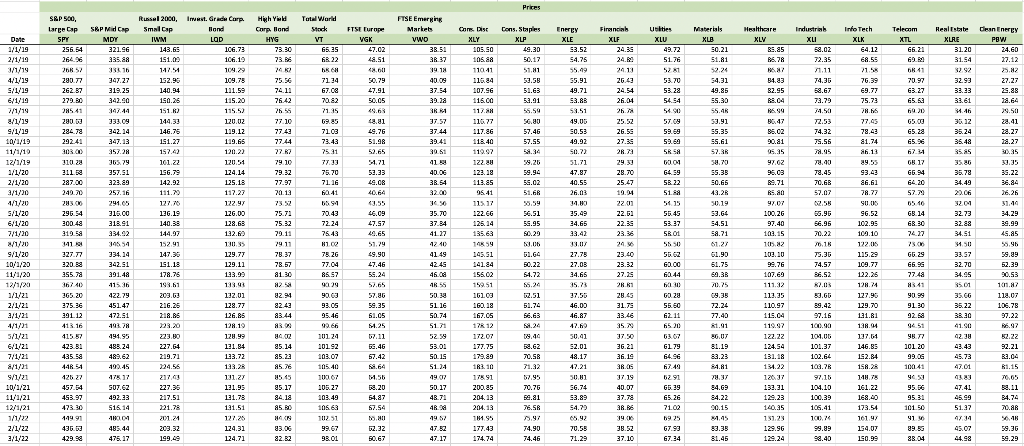
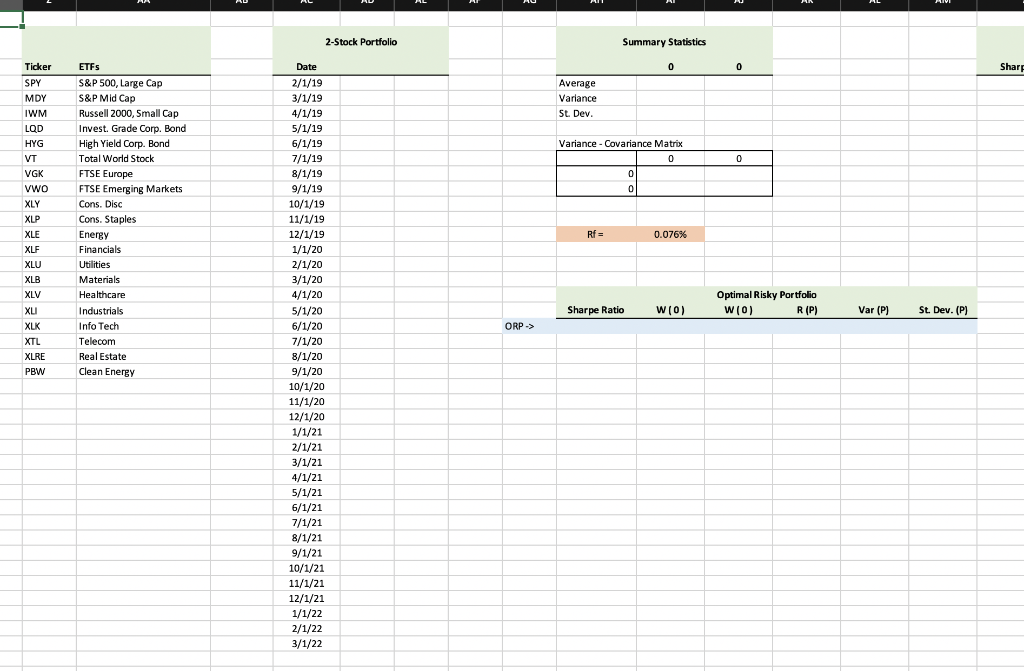
Use the historical data and template provided to create a model for the analysis of 2-securities portfolio. 1. Create 'drop down' menu and use LOOKUP command so you can choose any 2 securities for the analysis 2. Calculate Summary Statistics: Average, Variance, St. Dev., Covariance, Correlation 3. Construct Opportunity Set Table 4. Find Optimal Risky Portfolio 5. Create Opportunity Set Graph, including Opportunity Set, each one of the 2 securities with labels, and Capital Asset Line 6. Complete Quiz Project Part 1" on Canvas based on the answers from your excel template Select VGK and Vwo for your portfolio from your "drop down menu, answer all the questions based on these two securities. 1. VGK What the St. Dev. a. 2.22% b. 3.12% c. 5.59% d. 6.14% 2. What is the Covariance between VGK and VWO: a. 0.00222 b. 0.00237 c. 0.00312 d. 0.00487 a. 3. What is the correlation between VGK and VWO: 0.2220 b. 0.2719 c. 0.3974 d. 0.8164 4. What does correlation tell you about the relation between VGK and VWO: a. their returns tend to move very similar to each other b. their returns tend to move somewhat independently from each other their returns tend to move in the opposite direction relative to each other d. can not tell c. 5. What is the return on the portfolio that has 30% invested into VGK and 70% into VWO: a. 1.48% b. 0.83% c. 0.74% d. 0.71% e. 0.65% 6. What is the St. Dev. of the portfolio that has 30% invested into VGK and 70% into VWO- a. 6.186% b. 4.983% c. 4.873% d. 4.850% e. 5.172% 7. What are the investment proportions into VGK and VWO for the Minimum Risk Portfolio? a. 0.4/0.6 b. 0.2 / 0.8 0.1/0.9 d. 0.7 / 0.3 e. 0.5/0.5 c. 8. What is the maximum Sharpe Ratio? a. 0.1189 b. 0.1229 c. 0.1294 d. 0.1346 e. 0.1355 9. In order to achieve Optimal Risky Portfolio, how would you split your investment money between VGK and VWO? a. 0.7 /0.3 a b. 0.6/0.4 c. 0.5 / 0.5 d. 0.8 / 0.2 e. 0.9 /0.1 10. What is the proper finance name for the line that connects Rf security and the Optimal Risky Portfolio? a. ORP line b. Capital Asset Line c. Tangency line d. Risk Free line Final Combination Line e. IT wap SPY Biswal 2004 Grade Snus LOD S&PM MDY Iran Puh Turki Gand HYG Total World Street VT 2. WIAI RLS ITSE VGK vwO Gere. Dheere Steps KLY 1.94 12 Fy XLE NIK MLB 11 AIX nx Infe LK 6919 MIK MALE walang XURE 1 116 - 21/1 WE EESO 4.115 XTIL 50 21% LOR 0115 2 1 2113 1 ! 6 42 CPB NO NE 1.6 WE 671 NE 451 34 -79 307 -7,514 5.51 1 4514 -5.07 4479 NEZ Suit 4/1/19 5179 5/1/19 7/1/19 3. 5.B T.COM 7.455 -2.225 -10464 1 22% 11 3.23 -11 10 B4LX 7.419 112 9 22 -10 95 -7.174 6.13 2. 4.7856 4. 3. UN 1974 5.5 0.75 2.105 NPOT NEO NSIC 3 12 0. 07 0.4 QO LES 1.11 2.29% 2.03 -1.6754 W90 912 SON 0.32 2.Bax 112 2.174 2.59 45 -TC 7,455 COS 2.65% 2.47 1.6 1556 100 154 6.09 2.37 C.PN 5.02 1.456 015 -1 -3.094 30.65 DS 3.71% 4 B01 L65X 1.3456 445 1.24 C.SI 6.52 55 6.945 8.33 200 11.2016 MIT 2.7256 1.45 MED MOTO 2. 3 5.26 4225 493% 1 3 HN LON 24 -2.754 44 11 W BIRU SIT 2 1/11 10/11 11/11 12 1/1/20 2/1/20 1/20 4120 1 LIM 1 11 17 10 2.1 17 -1 818 NE 945 47 3265 2.99% 0.53% 5323 71 -227N AN 2 -2.17 NEZO WE NERE 71 1315 1.534 17.20 1.37. 2.45 6.25 7.37 15.324 1.4 19 -7445 15 29% 3581 KIZ NETT -2.53 % TGN 17.2012 7.154 -1.63 4.5 NRC 2178 14.29 2.67 wars . 7.22 15. BON 20. 5.25 2.58 S. TON 9.ON 143 7.924 13.00 11.39% 4.70 1.39 GEN 6.07 3.57 266 9.9685 13.27 NTOT NOTE OMA 6.05 2.94 19.251 9.66 5.25 1.52 4. 2.55 4.2 15.14 20.248 10.05 4.82 299 6.SIN SON 14.5 7.24 0925 7.5% 9.BGN 10.09 4.3 4.245 5.GEN 1.704 -2.60 DEATH! 5.615 4.62 28.735 9.75 DS 16.625 14.654 22.05 1965 24 2.13 1294 5.COM 0.52N 34.57% 15.96X 6.30 1.625 7.709 4.35% 1. 129 5.02 200 2.35 3.00 21 MON 10.2016 2.72 1.15 4.SI 42 . 2.89 NOT 0.29 51/20 TH11 2/1/2 ANTO 1999 SWT NOT NET NITT NOG WST NOGT NEET 3.229 UN 1315 - 4. 5.42% -17 7.2014 4.595 2 746 SEIF RE -0. . 2. 2.15% 25 -1.414 -20 1599 WS SU -1.07 SAN 2 VE 14 Wh We NIE Z She SEO We 19 BENE 16 26. 11 18.21% SIN 5.17% VRIE WOO 12.3 4. 100 2.2013 126 1.97 10 15.73% 7.COM 9.EX 157 MED WOES 610 179 6.78 310N 5.13% 11/12 12/1/20 1/12 2/1/21 w 41721 16.30 5. -1.275 11.6% NEET IN LEGX NOTS . 327 0.00 5. 1.735 49 NOT 56N 3.76 1.57 4.30 192 8.99 3.74 EN 1.6 12.54 35.97 9.STN 0359 2.58% 2.871 6.6 419 12 2.915 3.20 0.60 2.7 4.20 5.64% . 1.99% 0 WEZT NOT TZ 2.67 2.50 NES NAT NET 4129 7.14 RELT NEO MIST W997 4.2014 120 10 1.4% 1.06 ON 1743 2.100 2.67% 4.295 187 5. 9.2013 150 5.41% WO Nure NUE 1.98 4. MOD 1. 44 NOT . MET NIS NET SON ASE -10.55 48 12.15 1 111 -25 1. 1195 10 SILD 5.10 -1.199 2. 1.05 4.73% 00 VEEO 2015 2G NAZ 5.15 -2274 220 2. 4.37 433 4 2.50% SOIN 1819 -5.94% 150 1195 2205 4.44 S.MN 2.625 WO 2.95 4.97 7.30 0.80 4.2 - WIT TSO 1/ w123 91/21 30/1/21 11/1/21 12/1/21 1/172 11/12 w M C. 4.25% 224 2.905 VES 2 1795 1 1171 5.363 1.200 0.37% NGIT 5 ZSON 6.77 IN 0.9% 1. 17 -2.29% 12.23 1.685 C. -2.401 4.07 14.30 -5.BOX 3.50 120 3.A 102 -7.59 1.07 SGK 7.045 6.39 0.12% -700 7.62% 1157 5.000 167 20 31 20 10 112 2.17 5.09 1.49 3.05 . 50 . 4.45 7.14% 3.56 S.OON NET NO NET WICE 7.74 4.73% 2.00 O. 1. 1.35 6.709 AN NSC NOT 489% 1124 2.Sax -5 WOT NET NT NEO MIG WE -3.23 6.57 9. -20.31% 204 -1.26 1 ON -1.25 -1993 W NI -1 1125 . NET DE 3.25 -16 WARE WOES SLO 14 WET MOET SEO WEBO Average Varance St Dew 1.49% 0.00257 5.07% 0.43N 0.000 2.21 0.00395 6.29% 1.155 0.0020 4.92% 0.00056 2.37 SN 0.00237 4.57 0.00312 5.59 1.52 0.00335 6.225 WET O 11A 0.00151 3.90 1473 0.0107 11.99 0.00499 6.77% 0.00239 4.39% 1.47% 0.0032 6.18% 1. IN . 0.00395 4.42% 1.17 0.00320 6.23 24 0.00346 5.87 L. 10 0.0025 5.00 3.17 0.01749 13.22 6.74 5.96 Pro WORDEN AGAMA SK PEPPERO NON SPEED M ES BE 99 SNAN 1 PL EEN B EN NW PM KAN N4 ; go BNN 19 78 DOWE SERBANE = 5; i aa83a38aass ggage : $ MEN SENESNESENS ERASERHAN gsgg32:::a=%9: 89SSSNS 8X8 Ma Nyin ;; : G a: 22 ERNESBB SENSASSERRES SRPS PSR 238 =d38e5a2a 592yyxs99 3 : ,:: ; | BAB 888RIA SB8%BARBA ME HRABRONRG BERLEB&BURAN :B 839 2 ,ss 5 AD NE 2-Stock Portfolio Summary Statistics 0 0 Share Average Variance St. Dev. Ticker SPY MDY IWM LQD HYG VT VGK VWO XLY XLP Variance - Covariance Matrix 0 0 0 0 0 ETFS S&P 500, Large Cap S&P Mid Cap Russell 2000, Small Cap Invest. Grade Corp. Bond High Yield Corp. Bond Total World Stock FTSE Europe FTSE Emerging Markets Cons. Disc Cons. Staples Energy Financials Utilities Materials Healthcare Industrials Info Tech Telecom Real Estate Clean Energy Rf= 0.076% XLE XLF XLU XLB XLV Optimal Risky Portfolio W10) R (P) Sharpe Ratio W(0) Var (P) St. Dev. (P) XLI XLK XTL ORP -> XLRE PBW Date 2/1/19 3/1/19 4/1/19 5/1/19 6/1/19 7/1/19 8/1/19 9/1/19 10/1/19 11/1/19 12/1/19 1/1/20 2/1/20 3/1/20 4/1/20 5/1/20 6/1/20 7/1/20 8/1/20 9/1/20 10/1/20 11/1/20 12/1/20 1/1/21 2/1/21 3/1/21 4/1/21 5/1/21 6/1/21 7/1/21 8/1/21 9/1/21 10/1/21 11/1/21 12/1/21 1/1/22 2/1/22 3/1/22 Use the historical data and template provided to create a model for the analysis of 2-securities portfolio. 1. Create 'drop down' menu and use LOOKUP command so you can choose any 2 securities for the analysis 2. Calculate Summary Statistics: Average, Variance, St. Dev., Covariance, Correlation 3. Construct Opportunity Set Table 4. Find Optimal Risky Portfolio 5. Create Opportunity Set Graph, including Opportunity Set, each one of the 2 securities with labels, and Capital Asset Line 6. Complete Quiz Project Part 1" on Canvas based on the answers from your excel template Select VGK and Vwo for your portfolio from your "drop down menu, answer all the questions based on these two securities. 1. VGK What the St. Dev. a. 2.22% b. 3.12% c. 5.59% d. 6.14% 2. What is the Covariance between VGK and VWO: a. 0.00222 b. 0.00237 c. 0.00312 d. 0.00487 a. 3. What is the correlation between VGK and VWO: 0.2220 b. 0.2719 c. 0.3974 d. 0.8164 4. What does correlation tell you about the relation between VGK and VWO: a. their returns tend to move very similar to each other b. their returns tend to move somewhat independently from each other their returns tend to move in the opposite direction relative to each other d. can not tell c. 5. What is the return on the portfolio that has 30% invested into VGK and 70% into VWO: a. 1.48% b. 0.83% c. 0.74% d. 0.71% e. 0.65% 6. What is the St. Dev. of the portfolio that has 30% invested into VGK and 70% into VWO- a. 6.186% b. 4.983% c. 4.873% d. 4.850% e. 5.172% 7. What are the investment proportions into VGK and VWO for the Minimum Risk Portfolio? a. 0.4/0.6 b. 0.2 / 0.8 0.1/0.9 d. 0.7 / 0.3 e. 0.5/0.5 c. 8. What is the maximum Sharpe Ratio? a. 0.1189 b. 0.1229 c. 0.1294 d. 0.1346 e. 0.1355 9. In order to achieve Optimal Risky Portfolio, how would you split your investment money between VGK and VWO? a. 0.7 /0.3 a b. 0.6/0.4 c. 0.5 / 0.5 d. 0.8 / 0.2 e. 0.9 /0.1 10. What is the proper finance name for the line that connects Rf security and the Optimal Risky Portfolio? a. ORP line b. Capital Asset Line c. Tangency line d. Risk Free line Final Combination Line e. IT wap SPY Biswal 2004 Grade Snus LOD S&PM MDY Iran Puh Turki Gand HYG Total World Street VT 2. WIAI RLS ITSE VGK vwO Gere. Dheere Steps KLY 1.94 12 Fy XLE NIK MLB 11 AIX nx Infe LK 6919 MIK MALE walang XURE 1 116 - 21/1 WE EESO 4.115 XTIL 50 21% LOR 0115 2 1 2113 1 ! 6 42 CPB NO NE 1.6 WE 671 NE 451 34 -79 307 -7,514 5.51 1 4514 -5.07 4479 NEZ Suit 4/1/19 5179 5/1/19 7/1/19 3. 5.B T.COM 7.455 -2.225 -10464 1 22% 11 3.23 -11 10 B4LX 7.419 112 9 22 -10 95 -7.174 6.13 2. 4.7856 4. 3. UN 1974 5.5 0.75 2.105 NPOT NEO NSIC 3 12 0. 07 0.4 QO LES 1.11 2.29% 2.03 -1.6754 W90 912 SON 0.32 2.Bax 112 2.174 2.59 45 -TC 7,455 COS 2.65% 2.47 1.6 1556 100 154 6.09 2.37 C.PN 5.02 1.456 015 -1 -3.094 30.65 DS 3.71% 4 B01 L65X 1.3456 445 1.24 C.SI 6.52 55 6.945 8.33 200 11.2016 MIT 2.7256 1.45 MED MOTO 2. 3 5.26 4225 493% 1 3 HN LON 24 -2.754 44 11 W BIRU SIT 2 1/11 10/11 11/11 12 1/1/20 2/1/20 1/20 4120 1 LIM 1 11 17 10 2.1 17 -1 818 NE 945 47 3265 2.99% 0.53% 5323 71 -227N AN 2 -2.17 NEZO WE NERE 71 1315 1.534 17.20 1.37. 2.45 6.25 7.37 15.324 1.4 19 -7445 15 29% 3581 KIZ NETT -2.53 % TGN 17.2012 7.154 -1.63 4.5 NRC 2178 14.29 2.67 wars . 7.22 15. BON 20. 5.25 2.58 S. TON 9.ON 143 7.924 13.00 11.39% 4.70 1.39 GEN 6.07 3.57 266 9.9685 13.27 NTOT NOTE OMA 6.05 2.94 19.251 9.66 5.25 1.52 4. 2.55 4.2 15.14 20.248 10.05 4.82 299 6.SIN SON 14.5 7.24 0925 7.5% 9.BGN 10.09 4.3 4.245 5.GEN 1.704 -2.60 DEATH! 5.615 4.62 28.735 9.75 DS 16.625 14.654 22.05 1965 24 2.13 1294 5.COM 0.52N 34.57% 15.96X 6.30 1.625 7.709 4.35% 1. 129 5.02 200 2.35 3.00 21 MON 10.2016 2.72 1.15 4.SI 42 . 2.89 NOT 0.29 51/20 TH11 2/1/2 ANTO 1999 SWT NOT NET NITT NOG WST NOGT NEET 3.229 UN 1315 - 4. 5.42% -17 7.2014 4.595 2 746 SEIF RE -0. . 2. 2.15% 25 -1.414 -20 1599 WS SU -1.07 SAN 2 VE 14 Wh We NIE Z She SEO We 19 BENE 16 26. 11 18.21% SIN 5.17% VRIE WOO 12.3 4. 100 2.2013 126 1.97 10 15.73% 7.COM 9.EX 157 MED WOES 610 179 6.78 310N 5.13% 11/12 12/1/20 1/12 2/1/21 w 41721 16.30 5. -1.275 11.6% NEET IN LEGX NOTS . 327 0.00 5. 1.735 49 NOT 56N 3.76 1.57 4.30 192 8.99 3.74 EN 1.6 12.54 35.97 9.STN 0359 2.58% 2.871 6.6 419 12 2.915 3.20 0.60 2.7 4.20 5.64% . 1.99% 0 WEZT NOT TZ 2.67 2.50 NES NAT NET 4129 7.14 RELT NEO MIST W997 4.2014 120 10 1.4% 1.06 ON 1743 2.100 2.67% 4.295 187 5. 9.2013 150 5.41% WO Nure NUE 1.98 4. MOD 1. 44 NOT . MET NIS NET SON ASE -10.55 48 12.15 1 111 -25 1. 1195 10 SILD 5.10 -1.199 2. 1.05 4.73% 00 VEEO 2015 2G NAZ 5.15 -2274 220 2. 4.37 433 4 2.50% SOIN 1819 -5.94% 150 1195 2205 4.44 S.MN 2.625 WO 2.95 4.97 7.30 0.80 4.2 - WIT TSO 1/ w123 91/21 30/1/21 11/1/21 12/1/21 1/172 11/12 w M C. 4.25% 224 2.905 VES 2 1795 1 1171 5.363 1.200 0.37% NGIT 5 ZSON 6.77 IN 0.9% 1. 17 -2.29% 12.23 1.685 C. -2.401 4.07 14.30 -5.BOX 3.50 120 3.A 102 -7.59 1.07 SGK 7.045 6.39 0.12% -700 7.62% 1157 5.000 167 20 31 20 10 112 2.17 5.09 1.49 3.05 . 50 . 4.45 7.14% 3.56 S.OON NET NO NET WICE 7.74 4.73% 2.00 O. 1. 1.35 6.709 AN NSC NOT 489% 1124 2.Sax -5 WOT NET NT NEO MIG WE -3.23 6.57 9. -20.31% 204 -1.26 1 ON -1.25 -1993 W NI -1 1125 . NET DE 3.25 -16 WARE WOES SLO 14 WET MOET SEO WEBO Average Varance St Dew 1.49% 0.00257 5.07% 0.43N 0.000 2.21 0.00395 6.29% 1.155 0.0020 4.92% 0.00056 2.37 SN 0.00237 4.57 0.00312 5.59 1.52 0.00335 6.225 WET O 11A 0.00151 3.90 1473 0.0107 11.99 0.00499 6.77% 0.00239 4.39% 1.47% 0.0032 6.18% 1. IN . 0.00395 4.42% 1.17 0.00320 6.23 24 0.00346 5.87 L. 10 0.0025 5.00 3.17 0.01749 13.22 6.74 5.96 Pro WORDEN AGAMA SK PEPPERO NON SPEED M ES BE 99 SNAN 1 PL EEN B EN NW PM KAN N4 ; go BNN 19 78 DOWE SERBANE = 5; i aa83a38aass ggage : $ MEN SENESNESENS ERASERHAN gsgg32:::a=%9: 89SSSNS 8X8 Ma Nyin ;; : G a: 22 ERNESBB SENSASSERRES SRPS PSR 238 =d38e5a2a 592yyxs99 3 : ,:: ; | BAB 888RIA SB8%BARBA ME HRABRONRG BERLEB&BURAN :B 839 2 ,ss 5 AD NE 2-Stock Portfolio Summary Statistics 0 0 Share Average Variance St. Dev. Ticker SPY MDY IWM LQD HYG VT VGK VWO XLY XLP Variance - Covariance Matrix 0 0 0 0 0 ETFS S&P 500, Large Cap S&P Mid Cap Russell 2000, Small Cap Invest. Grade Corp. Bond High Yield Corp. Bond Total World Stock FTSE Europe FTSE Emerging Markets Cons. Disc Cons. Staples Energy Financials Utilities Materials Healthcare Industrials Info Tech Telecom Real Estate Clean Energy Rf= 0.076% XLE XLF XLU XLB XLV Optimal Risky Portfolio W10) R (P) Sharpe Ratio W(0) Var (P) St. Dev. (P) XLI XLK XTL ORP -> XLRE PBW Date 2/1/19 3/1/19 4/1/19 5/1/19 6/1/19 7/1/19 8/1/19 9/1/19 10/1/19 11/1/19 12/1/19 1/1/20 2/1/20 3/1/20 4/1/20 5/1/20 6/1/20 7/1/20 8/1/20 9/1/20 10/1/20 11/1/20 12/1/20 1/1/21 2/1/21 3/1/21 4/1/21 5/1/21 6/1/21 7/1/21 8/1/21 9/1/21 10/1/21 11/1/21 12/1/21 1/1/22 2/1/22 3/1/22
Step by Step Solution
There are 3 Steps involved in it

Get step-by-step solutions from verified subject matter experts