

Question: Please answer all ASAP and also please attach the excel document. Thank You. Use the historical data and template provided to create a model for
 Please answer all ASAP and also please attach the excel document. Thank You.
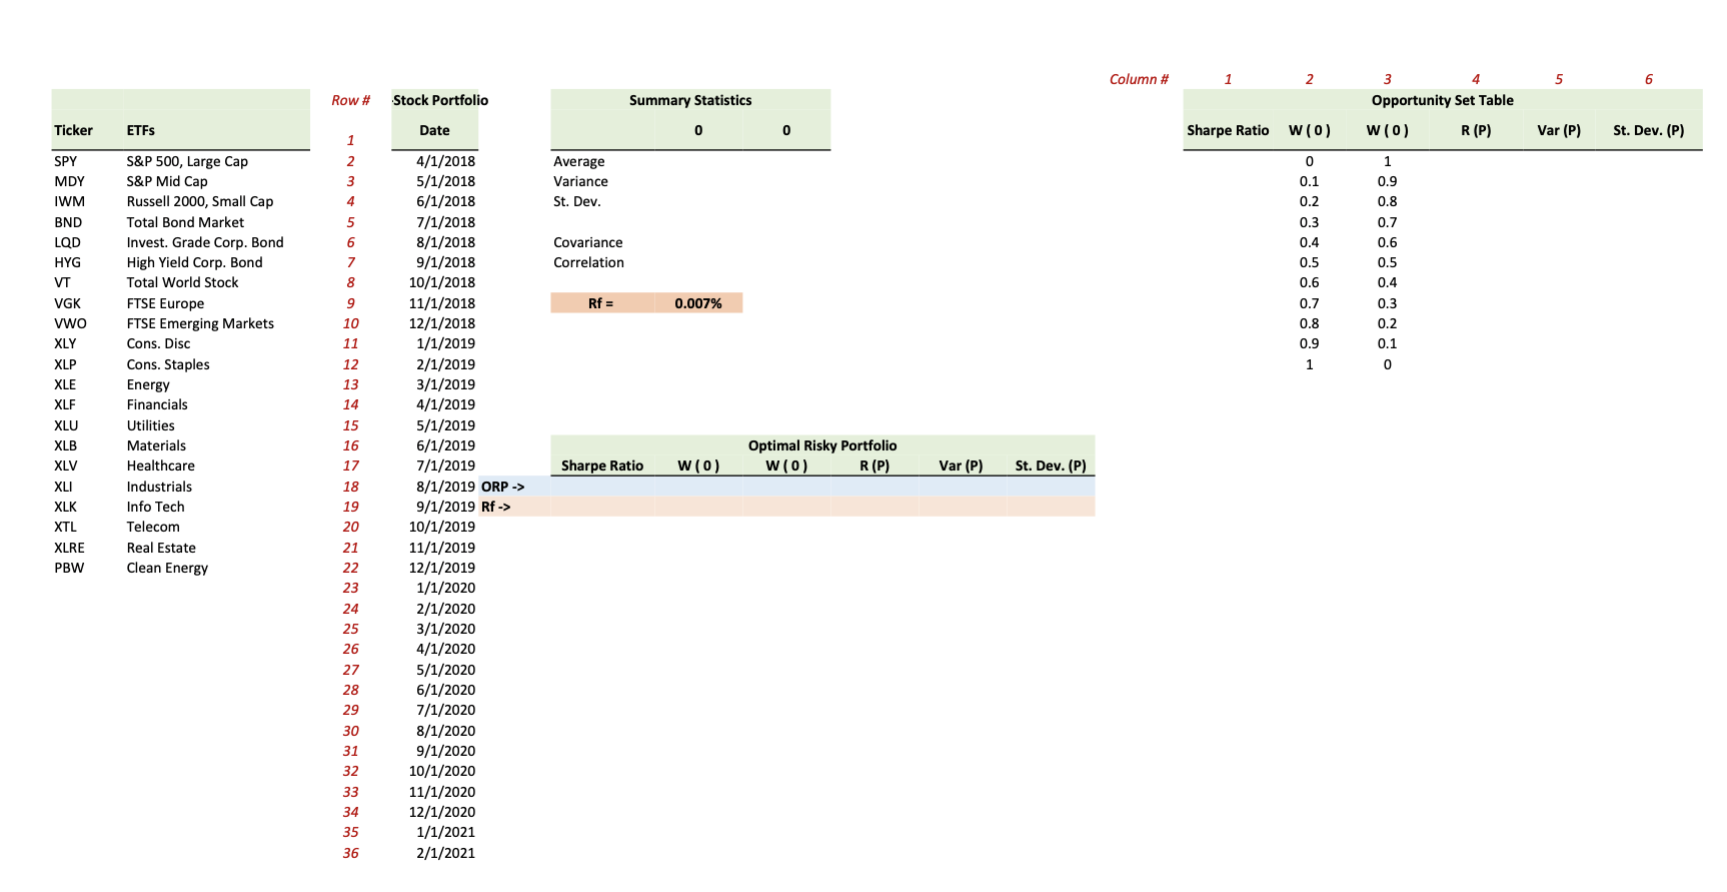
Use the historical data and template provided to create a model for the analysis of 2-securities portfolio. 1. Create 'drop down' menu and use LOOKUP command so you can choose any 2 securities for the analysis
2. Calculate Summary Statistics: Average, Variance, St. Dev., Covariance, Correlation
3. Construct Opportunity Set Table
4. Find Optimal Risky Portfolio
5. Create Opportunity Set Graph, including Opportunity Set, each one of the 2 securities with labels, and Capital Asset Line
6. Complete Quiz Project Part 1 on Canvas based on the answers from your excel template
Select SPY and XLU for your portfolio from your drop down menu, answer all the questions based on these two securities.
1. What is the St. Dev. for SPY:a. 1.45%b. 0.302%c. 3.02%%d. 5.50%
2. What is the Covariance between SPY and XLU:a. 0.00302b. 0.00114c. 0.00179d. 0.00435
3. What is the correlation between SPY and XLU: a. 0.0550b. 0.0011c. 0.4895d. 0.7832 4. What does correlation tell you about the relation between SPY and XLU:a. their returns tend to move somewhat similar to each otherb. their returns tend to move totally randomly relative to each otherc. their returns tend to move in the opposite direction relative to each otherd. can not tell
5. What is the return on the portfolio that has 30% invested into SPY and 70% into XLU:a. 0.87%b. 0.96%c. 1.04%d. 1.32%e. 1.45%
6. What is the St. Dev. of the portfolio that has 30% invested into SPY and 70% into XLU:a. 1.63%b. 1.79%c. 3.26%d. 4.03%e. 4.23%
7. What are the investment proportions into SPY and XLU for the Minimum Variance Portfolio?a. 0.4 / 0.6b. 0.3 / 0.7c. 0.8 / 0.2d. 0.5 / 0.5e. 0.1 / 0.9
8. What is the maximum Sharpe Ratio?a. 0.2037b. 0.2572c. 0.2768d. 0.2941e. 0.3215
9. In order to achieve Optimal Risky Portfolio, how would you split your investment money between SPY and XLU?a. 0.3 / 0.7b. 0.6 / 0.4c. 0.8 / 0.2d. 0.5 / 0.5e. 0.1 / 0.9
10. What is the proper finance name for the line that connects Rf security and the Optimal Risky Portfolio?a. ORP lineb. Tangency linec. Risk Free lined. Final Combination Linee. Capital Asset Line
Show transcribed image text
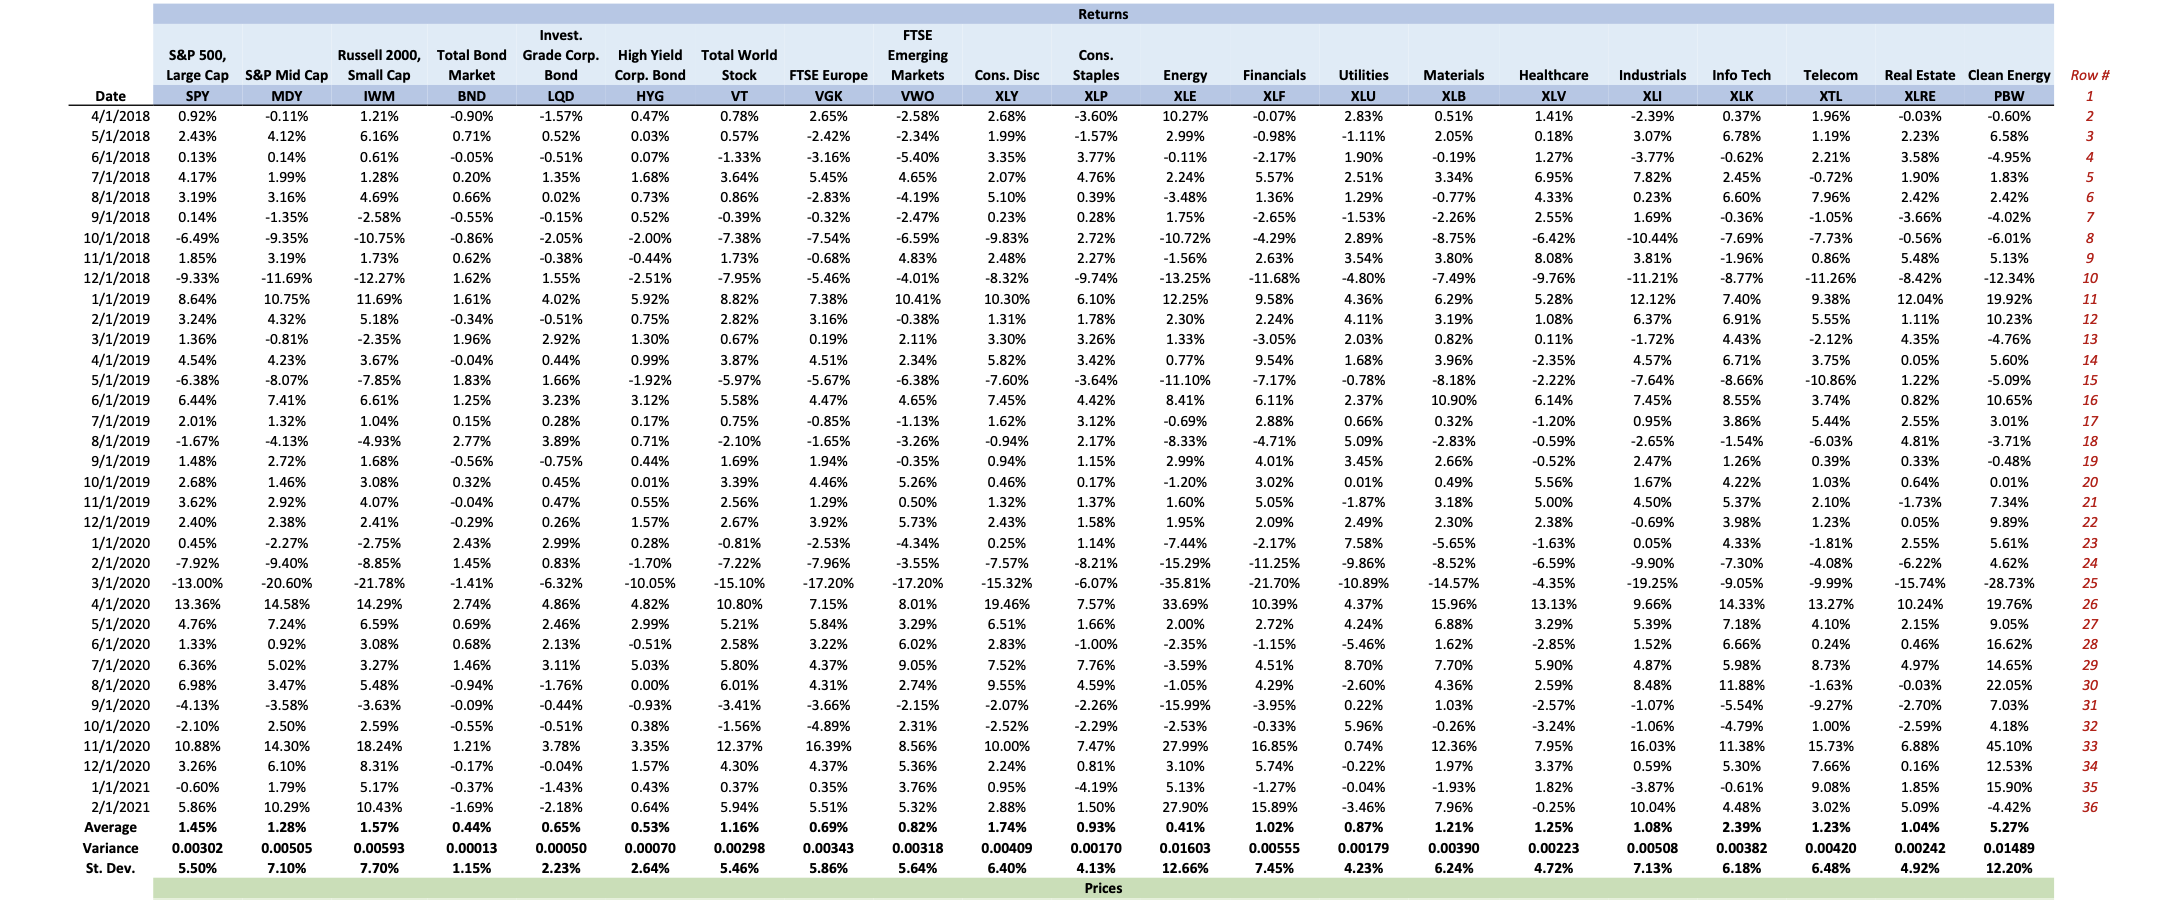
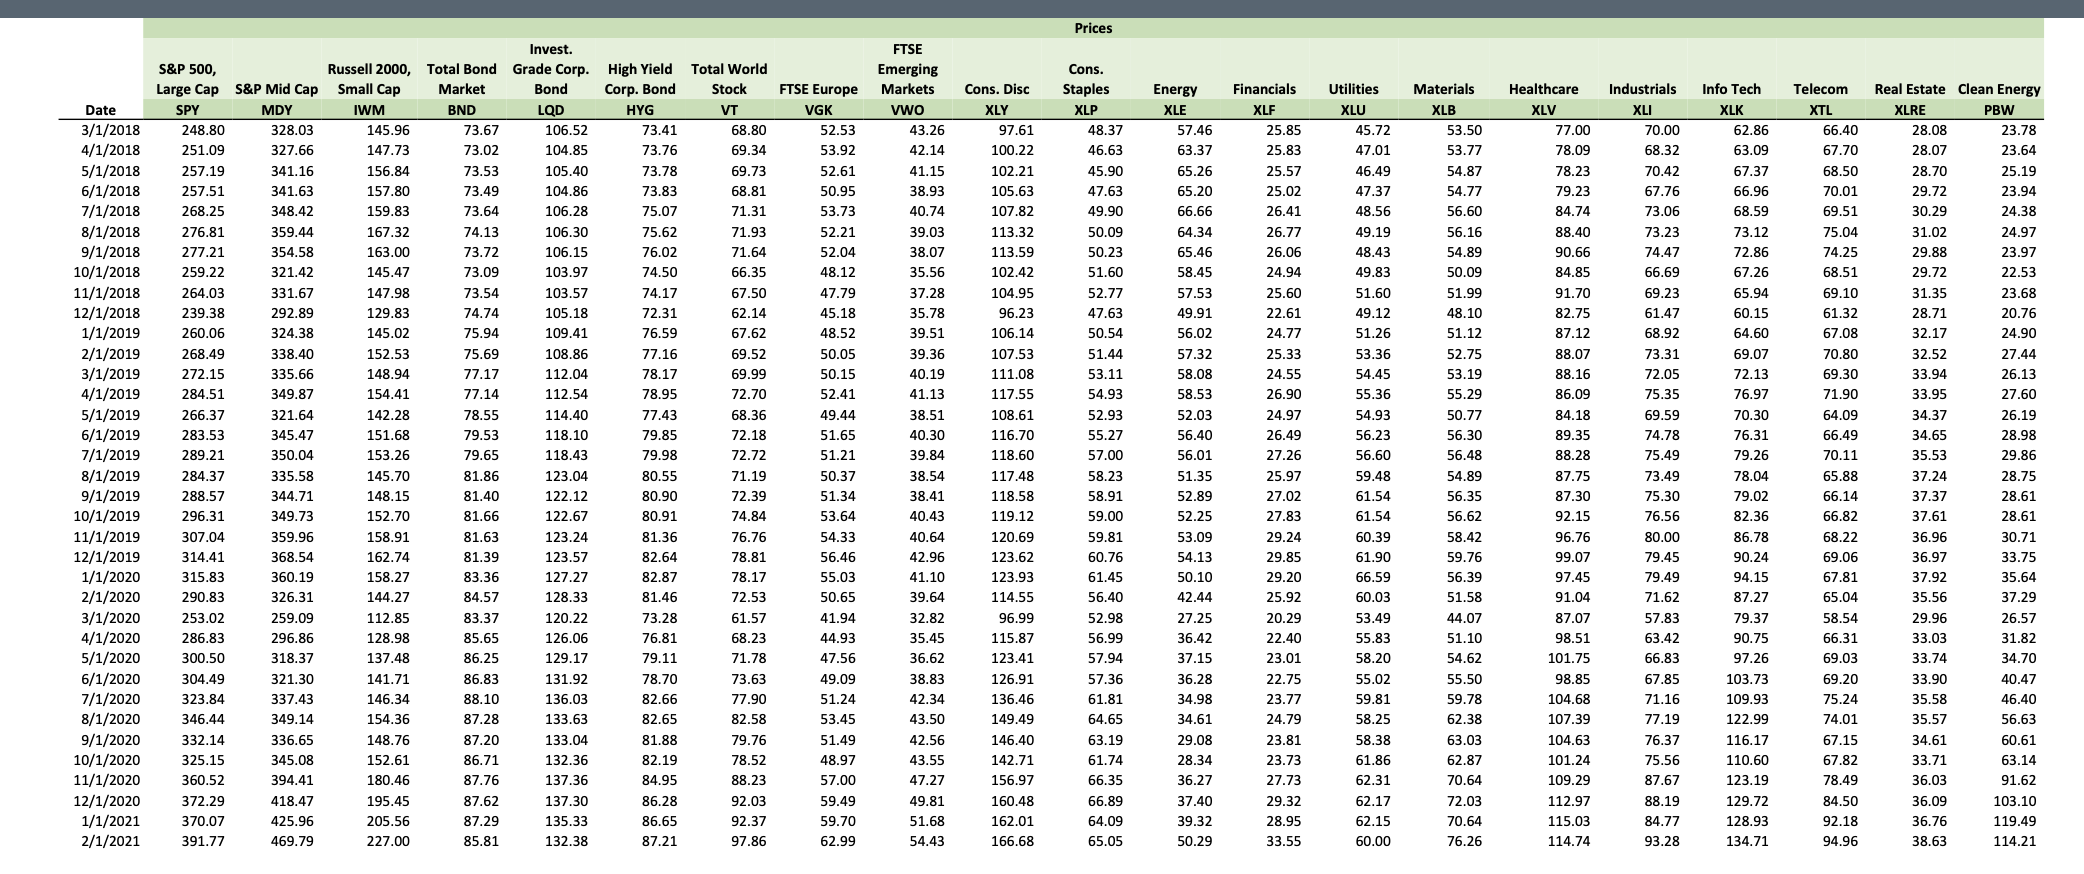
Returns Healthcare Info Tech BND XLV XLK PBW 0.14% -0.39% Cons. Disc XLY 2.68% 1.99% 3.35% 2.07% 5.10% 0.23% -9.83% 2.48% -8.32% 10.30% 1.31% 3.30% 5.82% -7.60% 7.45% 1.62% -2.10% Date 4/1/2018 5/1/2018 6/1/2018 7/1/2018 8/1/2018 9/1/2018 10/1/2018 11/1/2018 12/1/2018 1/1/2019 2/1/2019 3/1/2019 4/1/2019 5/1/2019 6/1/2019 7/1/2019 8/1/2019 9/1/2019 10/1/2019 11/1/2019 12/1/2019 1/1/2020 2/1/2020 3/1/2020 4/1/2020 5/1/2020 6/1/2020 7/1/2020 8/1/2020 9/1/2020 10/1/2020 11/1/2020 12/1/2020 1/1/2021 2/1/2021 Average Variance St. Dev. -0.94% S&P 500, Large Cap S&P Mid Cap SPY MDY 0.92% -0.11% 2.43% 4.12% 0.13% 0.14% 4.17% 1.99% 3.19% 3.16% -1.35% -6.49% -9.35% 1.85% 3.19% -9.33% -11.69% 8.64% 10.75% 3.24% 4.32% 1.36% -0.81% 4.54% 4.23% -6.38% -8.07% 6.44% 7.41% 2.01% 1.32% -1.67% -4.13% 1.48% 2.72% 2.68% 1.46% 3.62% 2.92% 2.40% 2.38% 0.45% -2.27% -7.92% -9.40% -13.00% -20.60% 13.36% 14.58% 4.76% 7.24% 1.33% 0.92% 6.36% 5.02% 6.98% 3.47% -4.13% -3.58% -2.10% 2.50% 10.88% 14.30% 3.26% 6.10% -0.60% 1.79% 5.86% 10.29% 1.45% 1.28% 0.00302 0.00505 5.50% 7.10% Invest. Russell 2000, Total Bond Grade Corp. High Yield Total World Small Cap Market Bond Corp. Bond Stock IWM LQD HYG VT 1.21% -0.90% -1.57% 0.47% 0.78% 6.16% 0.71% 0.52% 0.03% 0.57% 0.61% -0.05% -0.51% 0.07% -1.33% 1.28% 0.20% 1.35% 1.68% 3.64% 4.69% 0.66% 0.02% 0.73% 0.86% -2.58% -0.55% -0.15% 0.52% -10.75% -0.86% -2.05% -2.00% -7.38% 1.73% 0.62% -0.38% -0.44% 1.73% - 12.27% 1.62% 1.55% -2.51% -7.95% 11.69% 1.61% 4.02% 5.92% 8.82% 5.18% -0.34% -0.51% 0.75% 2.82% -2.35% 1.96% 2.92% 1.30% 0.67% 3.67% -0.04% 0.44% 0.99% 3.87% -7.85% 1.83% 1.66% -1.92% -5.97% 6.61% 1.25% 3.23% 3.12% 5.58% 1.04% 0.15% 0.28% 0.17% 0.75% -4.93% 2.77% 3.89% 0.71% 1.68% -0.56% -0.75% 0.44% 1.69% 3.08% 0.32% 0.45% 0.01% 3.39% 4.07% -0.04% 0.47% 0.55% 2.56% 2.41% -0.29% 0.26% 1.57% 2.67% -2.75% 2.43% 2.99% 0.28% -0.81% -8.85% 1.45% 0.83% -1.70% -7.22% -21.78% -1.41% -6.32% -10.05% -15.10% 14.29% 2.74% 4.86% 4.82% 10.80% 6.59% 0.69% 2.46% 2.99% 5.21% 3.08% 0.68% 2.13% -0.51% 2.58% 3.27% 1.46% 3.11% 5.03% 5.80% 5.48% -0.94% -1.76% 0.00% 6.01% -3.63% -0.09% -0.44% -0.93% -3.41% 2.59% -0.55% -0.51% 0.38% -1.56% 18.24% 1.21% 3.78% 3.35% 12.37% 8.31% -0.17% -0.04% 1.57% 4.30% 5.17% -0.37% -1.43% 0.43% 0.37% 10.43% -1.69% -2.18% 0.64% 5.94% 1.57% 0.44% 0.65% 0.53% 1.16% 0.00593 0.00013 0.00050 0.00070 0.00298 7.70% 1.15% 2.23% 2.64% 5.46% Cons. Staples XLP -3.60% -1.57% 3.77% 4.76% 0.39% 0.28% 2.72% 2.27% -9.74% 6.10% 1.78% 3.26% 3.42% -3.64% 4.42% 3.12% 2.17% 1.15% 0.17% 1.37% 1.58% 1.14% -8.21% -6.07% FTSE Europe VGK 2.65% -2.42% -3.16% 5.45% -2.83% -0.32% -7.54% -0.68% -5.46% 7.38% 3.16% 0.19% 4.51% -5.67% 4.47% -0.85% -1.65% 1.94% 4.46% 1.29% 3.92% -2.53% -7.96% -17.20% 7.15% 5.84% 3.22% 4.37% 4.31% -3.66% -4.89% 16.39% 4.37% 0.35% 5.51% 0.69% 0.00343 5.86% FTSE Emerging Markets vwo -2.58% -2.34% -5.40% 4.65% -4.19% -2.47% -6.59% 4.83% -4.01% 10.41% -0.38% 2.11% 2.34% -6.38% 4.65% -1.13% -3.26% -0.35% 5.26% 0.50% 5.73% -4.34% -3.55% -17.20% 8.01% 3.29% 6.02% 9.05% 2.74% -2.15% 2.31% 8.56% 5.36% 3.76% 5.32% 0.82% 0.00318 5.64% 0.94% 0.46% 1.32% 2.43% 0.25% -7.57% -15.32% 19.46% 6.51% 2.83% 7.52% Energy XLE 10.27% 2.99% -0.11% 2.24% -3.48% 1.75% -10.72% -1.56% -13.25% 12.25% 2.30% 1.33% 0.77% -11.10% 8.41% -0.69% -8.33% 2.99% -1.20% 1.60% 1.95% -7.44% -15.29% -35.81% 33.69% 2.00% -2.35% -3.59% -1.05% -15.99% -2.53% 27.99% 3.10% 5.13% 27.90% 0.41% 0.01603 12.66% Financials XLF -0.07% -0.98% -2.17% 5.57% 1.36% -2.65% -4.29% 2.63% -11.68% 9.58% 2.24% -3.05% 9.54% -7.17% 6.11% 2.88% -4.71% 4.01% 3.02% 5.05% 2.09% -2.17% -11.25% -21.70% 10.39% 2.72% -1.15% 4.51% 4.29% -3.95% -0.33% 16.85% 5.74% -1.27% 15.89% 1.02% 0.00555 7.45% Utilities XLU 2.83% -1.11% 1.90% 2.51% 1.29% -1.53% 2.89% 3.54% -4.80% 4.36% 4.11% 2.03% 1.68% -0.78% 2.37% 0.66% 5.09% 3.45% 0.01% -1.87% 2.49% 7.58% -9.86% -10.89% 4.37% 4.24% -5.46% 8.70% -2.60% 0.22% 5.96% 0.74% -0.22% -0.04% -3.46% 0.87% 0.00179 4.23% Materials XLB 0.51% 2.05% -0.19% 3.34% -0.77% -2.26% -8.75% 3.80% -7.49% 6.29% 3.19% 0.82% 3.96% -8.18% 10.90% 0.32% -2.83% 2.66% 0.49% 3.18% 2.30% -5.65% -8.52% -14.57% 15.96% 6.88% 1.62% 7.70% 4.36% 1.03% -0.26% 12.36% 1.97% -1.93% 7.96% 1.21% 0.00390 6.24% 1.41% 0.18% 1.27% 6.95% 4.33% 2.55% -6.42% 8.08% -9.76% 5.28% 1.08% 0.11% -2.35% -2.22% 6.14% -1.20% -0.59% -0.52% 5.56% 5.00% 2.38% -1.63% -6.59% -4.35% 13.13% 3.29% -2.85% 5.90% 2.59% -2.57% -3.24% 7.95% 3.37% 1.82% -0.25% 1.25% 0.00223 4.72% Industrials XLI -2.39% 3.07% -3.77% 7.82% 0.23% 1.69% -10.44% 3.81% -11.21% 12.12% 6.37% -1.72% 4.57% -7.64% 7.45% 0.95% -2.65% 2.47% 1.67% 4.50% -0.69% 0.05% -9.90% -19.25% 9.66% 5.39% 1.52% 4.87% 8.48% -1.07% -1.06% 16.03% 0.59% -3.87% 10.04% 1.08% 0.00508 7.13% 0.37% 6.78% -0.62% 2.45% 6.60% -0.36% -7.69% -1.96% -8.77% 7.40% 6.91% 4.43% 6.71% -8.66% 8.55% 3.86% -1.54% 1.26% 4.22% 5.37% 3.98% 4.33% -7.30% -9.05% 14.33% 7.18% 6.66% 5.98% 11.88% -5.54% -4.79% 11.38% 5.30% -0.61% 4.48% 2.39% 0.00382 6.18% Telecom XTL 1.96% 1.19% 2.21% -0.72% 7.96% -1.05% -7.73% 0.86% - 11.26% 9.38% 5.55% -2.12% 3.75% -10.86% 3.74% 5.44% -6.03% 0.39% 1.03% 2.10% 1.23% -1.81% -4.08% -9.99% 13.27% 4.10% 0.24% 8.73% -1.63% -9.27% 1.00% 15.73% 7.66% 9.08% 3.02% 1.23% 0.00420 6.48% Real Estate Clean Energy Row # XLRE 1 -0.03% -0.60% 2 2.23% 6.58% 3 3.58% -4.95% 4 1.90% 1.83% 5 2.42% 2.42% 6 -3.66% -4.02% 7 -0.56% -6.01% 8 5.48% 5.13% 9 -8.42% -12.34% 10 12.04% 19.92% 11 1.11% 10.23% 12 4.35% -4.76% 13 0.05% 5.60% 14 1.22% -5.09% 15 0.82% 10.65% 16 2.55% 3.01% 17 4.81% -3.71% 18 0.33% -0.48% 19 0.64% 0.01% 20 -1.73% 7.34% 21 0.05% 9.89% 22 2.55% 5.61% 23 -6.22% 4.62% 24 -15.74% -28.73% 25 10.24% 19.76% 26 2.15% 9.05% 27 0.46% 16.62% 28 4.97% 14.65% 29 -0.03% 22.05% 30 -2.70% 7.03% 31 -2.59% 4.18% 32 6.88% 45.10% 33 0.16% 12.53% 34 1.85% 15.90% 35 5.09% -4.42% 36 1.04% 5.27% 0.00242 0.01489 4.92% 12.20% 7.57% 9.55% -2.07% -2.52% 10.00% 2.24% 0.95% 2.88% 1.74% 0.00409 6.40% 1.66% -1.00% 7.76% 4.59% -2.26% -2.29% 7.47% 0.81% -4.19% 1.50% 0.93% 0.00170 4.13% Prices Prices 22.53 Financials XLF 25.85 25.83 25.57 25.02 26.41 26.77 26.06 24.94 25.60 22.61 24.77 25.33 24.55 26.90 24.97 26.49 Date 3/1/2018 4/1/2018 5/1/2018 6/1/2018 7/1/2018 8/1/2018 9/1/2018 10/1/2018 11/1/2018 12/1/2018 1/1/2019 2/1/2019 3/1/2019 4/1/2019 5/1/2019 6/1/2019 7/1/2019 8/1/2019 9/1/2019 10/1/2019 11/1/2019 12/1/2019 1/1/2020 2/1/2020 3/1/2020 4/1/2020 5/1/2020 6/1/2020 7/1/2020 8/1/2020 9/1/2020 10/1/2020 11/1/2020 12/1/2020 1/1/2021 2/1/2021 S&P 500, Large Cap S&P Mid Cap SPY MDY 248.80 328.03 251.09 327.66 257.19 341.16 257.51 341.63 268.25 348.42 276.81 359.44 277.21 354.58 259.22 321.42 264.03 331.67 239.38 292.89 260.06 324.38 268.49 338.40 272.15 335.66 284.51 349.87 266.37 321.64 283.53 345.47 289.21 350.04 284.37 335.58 288.57 344.71 296.31 349.73 307.04 359.96 314.41 368.54 315.83 360.19 290.83 326.31 253.02 259.09 286.83 296.86 300.50 318.37 304.49 321.30 323.84 337.43 346.44 349.14 332.14 336.65 325.15 345.08 360.52 394.41 372.29 418.47 370.07 391.77 469.79 Invest. Russell 2000, Total Bond Grade Corp. High Yield Small Cap Market Bond Corp. Bond IWM BND LOD HYG 145.96 73.67 106.52 73.41 147.73 73.02 104.85 73.76 156.84 73.53 105.40 73.78 157.80 73.49 104.86 73.83 159.83 73.64 106.28 75.07 167.32 74.13 106.30 75.62 163.00 73.72 106.15 76.02 145.47 73.09 103.97 74.50 147.98 73.54 103.57 74.17 129.83 74.74 105.18 72.31 145.02 75.94 109.41 76.59 152.53 75.69 108.86 77.16 148.94 77.17 112.04 78.17 154.41 77.14 112.54 78.95 142.28 78.55 114.40 77.43 151.68 79.53 118.10 79.85 153.26 79.65 118.43 79.98 145.70 81.86 123.04 80.55 148.15 81.40 122.12 80.90 152.70 81.66 122.67 80.91 158.91 81.63 123.24 81.36 162.74 81.39 123.57 82.64 158.27 83.36 127.27 82.87 144.27 84.57 128.33 81.46 112.85 83.37 120.22 73.28 128.98 85.65 126.06 76.81 137.48 86.25 129.17 79.11 141.71 86.83 131.92 78.70 146.34 88.10 136.03 82.66 154.36 87.28 133.63 82.65 148.76 87.20 133.04 81.88 152.61 86.71 132.36 82.19 180.46 87.76 137.36 84.95 195.45 87.62 137.30 86.28 205.56 135.33 227.00 85.81 132.38 87.21 Total World Stock VT 68.80 69.34 69.73 68.81 71.31 71.93 71.64 66.35 67.50 62.14 67.62 69.52 69.99 72.70 68.36 72.18 72.72 71.19 72.39 74.84 76.76 FTSE Europe VGK 52.53 53.92 52.61 50.95 53.73 52.21 52.04 48.12 47.79 45.18 48.52 50.05 50.15 52.41 49.44 51.65 51.21 50.37 51.34 53.64 54.33 56.46 55.03 FTSE Emerging Markets vwo 43.26 42.14 41.15 38.93 40.74 39.03 38.07 35.56 37.28 35.78 39.51 39.36 40.19 41.13 38.51 40.30 39.84 38.54 38.41 40.43 40.64 Cons. Staples XLP 48.37 46.63 45.90 47.63 49.90 50.09 50.23 51.60 52.77 47.63 50.54 51.44 53.11 54.93 52.93 55.27 57.00 58.23 58.91 59.00 59.81 60.76 61.45 56.40 52.98 56.99 57.94 57.36 61.81 64.65 63.19 61.74 66.35 66.89 64.09 65.05 Cons. Disc XLY 97.61 100.22 102.21 105.63 107.82 113.32 113.59 102.42 104.95 96.23 106.14 107.53 111.08 117.55 108.61 116.70 118.60 117.48 118.58 119.12 120.69 123.62 123.93 114.55 96.99 115.87 123.41 126.91 136.46 149.49 146.40 142.71 156.97 160.48 162.01 166.68 27.26 Energy XLE 57.46 63.37 65.26 65.20 66.66 64.34 65.46 58.45 57.53 49.91 56.02 57.32 58.08 58.53 52.03 56.40 56.01 51.35 52.89 52.25 53.09 54.13 50.10 42.44 27.25 36.42 37.15 36.28 34.98 34.61 29.08 28.34 36.27 37.40 39.32 50.29 Utilities XLU 45.72 47.01 46.49 47.37 48.56 49.19 48.43 49.83 51.60 49.12 51.26 53.36 54.45 55.36 54.93 56.23 56.60 59.48 61.54 61.54 60.39 61.90 66.59 60.03 53.49 55.83 58.20 55.02 59.81 58.25 58.38 61.86 62.31 62.17 62.15 60.00 Materials XLB 53.50 53.77 54.87 54.77 56.60 56.16 54.89 50.09 51.99 48.10 51.12 52.75 53.19 55.29 50.77 56.30 56.48 54.89 56.35 56.62 58.42 59.76 56.39 51.58 44.07 51.10 54.62 55.50 59.78 62.38 63.03 62.87 70.64 72.03 70.64 76.26 Healthcare XLV 77.00 78.09 78.23 79.23 84.74 88.40 90.66 84.85 91.70 82.75 87.12 88.07 88.16 86.09 84.18 89.35 88.28 87.75 87.30 92.15 96.76 99.07 97.45 91.04 87.07 98.51 101.75 98.85 104.68 107.39 104.63 101.24 109.29 112.97 115.03 114.74 Industrials XLI 70.00 68.32 70.42 67.76 73.06 73.23 74.47 66.69 69.23 61.47 68.92 73.31 72.05 75.35 69.59 74.78 75.49 73.49 75.30 76.56 80.00 79.45 79.49 71.62 57.83 63.42 66.83 67.85 71.16 77.19 76.37 75.56 87.67 88.19 84.77 93.28 Info Tech XLK 62.86 63.09 67.37 66.96 68.59 73.12 72.86 67.26 65.94 60.15 64.60 69.07 72.13 76.97 70.30 76.31 79.26 78.04 79.02 82.36 86.78 Telecom XTL 66.40 67.70 68.50 70.01 69.51 75.04 74.25 68.51 69.10 61.32 67.08 70.80 69.30 71.90 64.09 66.49 70.11 65.88 66.14 66.82 68.22 69.06 67.81 65.04 58.54 66.31 69.03 69.20 75.24 74.01 67.15 67.82 78.49 84.50 92.18 94.96 Real Estate Clean Energy XLRE PBW 28.08 23.78 28.07 23.64 28.70 25.19 29.72 23.94 30.29 24.38 31.02 24.97 29.88 23.97 29.72 31.35 23.68 28.71 20.76 32.17 24.90 32.52 27.44 33.94 26.13 33.95 27.60 34.37 26.19 34.65 28.98 35.53 29.86 37.24 28.75 37.37 28.61 37.61 28.61 36.96 30.71 36.97 33.75 37.92 35.64 37.29 29.96 26.57 33.03 31.82 33.74 34.70 33.90 40.47 35.58 46.40 35.57 56.63 34.61 60.61 33.71 63.14 36.03 91.62 36.09 103.10 36.76 119.49 38.63 114.21 78.81 42.96 90.24 50.65 35.56 78.17 72.53 61.57 68.23 71.78 73.63 77.90 82.58 79.76 78.52 88.23 92.03 92.37 97.86 41.94 44.93 47.56 49.09 51.24 53.45 51.49 48.97 57.00 59.49 59.70 62.99 41.10 39.64 32.82 35.45 36.62 38.83 42.34 43.50 42.56 43.55 47.27 49.81 51.68 54.43 25.97 27.02 27.83 29.24 29.85 29.20 25.92 20.29 22.40 23.01 22.75 23.77 24.79 23.81 23.73 27.73 29.32 28.95 33.55 94.15 87.27 79.37 90.75 97.26 103.73 109.93 122.99 116.17 110.60 123.19 129.72 128.93 134.71 425.96 87.29 86.65 Column # 1 5 6 Row # Stock Portfolio Summary Statistics 3 4 Opportunity Set Table W(0) R(P) Ticker ETFs Date 0 0 Sharpe Ratio W(0) Var (P) St. Dev. (P) SPY MDY 1 2 3 4 Average Variance St. Dev. IWM 5 6 Covariance Correlation 1 0.9 0.8 0.7 0.6 0.5 0.4 0.3 0.2 0.1 7 0 0.1 0.2 0.3 0.4 0.5 0.6 0.7 0.8 0.9 1 8 9 Rf = 0.007% 10 11 S&P 500, Large Cap S&P Mid Cap Russell 2000, Small Cap Total Bond Market Invest. Grade Corp. Bond High Yield Corp. Bond Total World Stock FTSE Europe FTSE Emerging Markets Cons. Disc Cons. Staples Energy Financials Utilities Materials Healthcare Industrials Info Tech Telecom Real Estate Clean Energy BND LQD HYG VT VGK VWO XLY XLP XLE XLF XLU XLB XLV XLI XLK XTL XLRE PBW 0 12 13 14 15 16 17 Optimal Risky Portfolio W(0) R(P) Sharpe Ratio W(0) Var (P) St. Dev. (P) 18 19 4/1/2018 5/1/2018 6/1/2018 7/1/2018 8/1/2018 9/1/2018 10/1/2018 11/1/2018 12/1/2018 1/1/2019 2/1/2019 3/1/2019 4/1/2019 5/1/2019 6/1/2019 7/1/2019 8/1/2019 ORP -> 9/1/2019 Rf -> 10/1/2019 11/1/2019 12/1/2019 1/1/2020 2/1/2020 3/1/2020 4/1/2020 5/1/2020 6/1/2020 7/1/2020 8/1/2020 9/1/2020 10/1/2020 11/1/2020 12/1/2020 1/1/2021 2/1/2021 20 21 22 23 24 25 26 27 28 29 30 31 32 33 34 35 36 Returns Healthcare Info Tech BND XLV XLK PBW 0.14% -0.39% Cons. Disc XLY 2.68% 1.99% 3.35% 2.07% 5.10% 0.23% -9.83% 2.48% -8.32% 10.30% 1.31% 3.30% 5.82% -7.60% 7.45% 1.62% -2.10% Date 4/1/2018 5/1/2018 6/1/2018 7/1/2018 8/1/2018 9/1/2018 10/1/2018 11/1/2018 12/1/2018 1/1/2019 2/1/2019 3/1/2019 4/1/2019 5/1/2019 6/1/2019 7/1/2019 8/1/2019 9/1/2019 10/1/2019 11/1/2019 12/1/2019 1/1/2020 2/1/2020 3/1/2020 4/1/2020 5/1/2020 6/1/2020 7/1/2020 8/1/2020 9/1/2020 10/1/2020 11/1/2020 12/1/2020 1/1/2021 2/1/2021 Average Variance St. Dev. -0.94% S&P 500, Large Cap S&P Mid Cap SPY MDY 0.92% -0.11% 2.43% 4.12% 0.13% 0.14% 4.17% 1.99% 3.19% 3.16% -1.35% -6.49% -9.35% 1.85% 3.19% -9.33% -11.69% 8.64% 10.75% 3.24% 4.32% 1.36% -0.81% 4.54% 4.23% -6.38% -8.07% 6.44% 7.41% 2.01% 1.32% -1.67% -4.13% 1.48% 2.72% 2.68% 1.46% 3.62% 2.92% 2.40% 2.38% 0.45% -2.27% -7.92% -9.40% -13.00% -20.60% 13.36% 14.58% 4.76% 7.24% 1.33% 0.92% 6.36% 5.02% 6.98% 3.47% -4.13% -3.58% -2.10% 2.50% 10.88% 14.30% 3.26% 6.10% -0.60% 1.79% 5.86% 10.29% 1.45% 1.28% 0.00302 0.00505 5.50% 7.10% Invest. Russell 2000, Total Bond Grade Corp. High Yield Total World Small Cap Market Bond Corp. Bond Stock IWM LQD HYG VT 1.21% -0.90% -1.57% 0.47% 0.78% 6.16% 0.71% 0.52% 0.03% 0.57% 0.61% -0.05% -0.51% 0.07% -1.33% 1.28% 0.20% 1.35% 1.68% 3.64% 4.69% 0.66% 0.02% 0.73% 0.86% -2.58% -0.55% -0.15% 0.52% -10.75% -0.86% -2.05% -2.00% -7.38% 1.73% 0.62% -0.38% -0.44% 1.73% - 12.27% 1.62% 1.55% -2.51% -7.95% 11.69% 1.61% 4.02% 5.92% 8.82% 5.18% -0.34% -0.51% 0.75% 2.82% -2.35% 1.96% 2.92% 1.30% 0.67% 3.67% -0.04% 0.44% 0.99% 3.87% -7.85% 1.83% 1.66% -1.92% -5.97% 6.61% 1.25% 3.23% 3.12% 5.58% 1.04% 0.15% 0.28% 0.17% 0.75% -4.93% 2.77% 3.89% 0.71% 1.68% -0.56% -0.75% 0.44% 1.69% 3.08% 0.32% 0.45% 0.01% 3.39% 4.07% -0.04% 0.47% 0.55% 2.56% 2.41% -0.29% 0.26% 1.57% 2.67% -2.75% 2.43% 2.99% 0.28% -0.81% -8.85% 1.45% 0.83% -1.70% -7.22% -21.78% -1.41% -6.32% -10.05% -15.10% 14.29% 2.74% 4.86% 4.82% 10.80% 6.59% 0.69% 2.46% 2.99% 5.21% 3.08% 0.68% 2.13% -0.51% 2.58% 3.27% 1.46% 3.11% 5.03% 5.80% 5.48% -0.94% -1.76% 0.00% 6.01% -3.63% -0.09% -0.44% -0.93% -3.41% 2.59% -0.55% -0.51% 0.38% -1.56% 18.24% 1.21% 3.78% 3.35% 12.37% 8.31% -0.17% -0.04% 1.57% 4.30% 5.17% -0.37% -1.43% 0.43% 0.37% 10.43% -1.69% -2.18% 0.64% 5.94% 1.57% 0.44% 0.65% 0.53% 1.16% 0.00593 0.00013 0.00050 0.00070 0.00298 7.70% 1.15% 2.23% 2.64% 5.46% Cons. Staples XLP -3.60% -1.57% 3.77% 4.76% 0.39% 0.28% 2.72% 2.27% -9.74% 6.10% 1.78% 3.26% 3.42% -3.64% 4.42% 3.12% 2.17% 1.15% 0.17% 1.37% 1.58% 1.14% -8.21% -6.07% FTSE Europe VGK 2.65% -2.42% -3.16% 5.45% -2.83% -0.32% -7.54% -0.68% -5.46% 7.38% 3.16% 0.19% 4.51% -5.67% 4.47% -0.85% -1.65% 1.94% 4.46% 1.29% 3.92% -2.53% -7.96% -17.20% 7.15% 5.84% 3.22% 4.37% 4.31% -3.66% -4.89% 16.39% 4.37% 0.35% 5.51% 0.69% 0.00343 5.86% FTSE Emerging Markets vwo -2.58% -2.34% -5.40% 4.65% -4.19% -2.47% -6.59% 4.83% -4.01% 10.41% -0.38% 2.11% 2.34% -6.38% 4.65% -1.13% -3.26% -0.35% 5.26% 0.50% 5.73% -4.34% -3.55% -17.20% 8.01% 3.29% 6.02% 9.05% 2.74% -2.15% 2.31% 8.56% 5.36% 3.76% 5.32% 0.82% 0.00318 5.64% 0.94% 0.46% 1.32% 2.43% 0.25% -7.57% -15.32% 19.46% 6.51% 2.83% 7.52% Energy XLE 10.27% 2.99% -0.11% 2.24% -3.48% 1.75% -10.72% -1.56% -13.25% 12.25% 2.30% 1.33% 0.77% -11.10% 8.41% -0.69% -8.33% 2.99% -1.20% 1.60% 1.95% -7.44% -15.29% -35.81% 33.69% 2.00% -2.35% -3.59% -1.05% -15.99% -2.53% 27.99% 3.10% 5.13% 27.90% 0.41% 0.01603 12.66% Financials XLF -0.07% -0.98% -2.17% 5.57% 1.36% -2.65% -4.29% 2.63% -11.68% 9.58% 2.24% -3.05% 9.54% -7.17% 6.11% 2.88% -4.71% 4.01% 3.02% 5.05% 2.09% -2.17% -11.25% -21.70% 10.39% 2.72% -1.15% 4.51% 4.29% -3.95% -0.33% 16.85% 5.74% -1.27% 15.89% 1.02% 0.00555 7.45% Utilities XLU 2.83% -1.11% 1.90% 2.51% 1.29% -1.53% 2.89% 3.54% -4.80% 4.36% 4.11% 2.03% 1.68% -0.78% 2.37% 0.66% 5.09% 3.45% 0.01% -1.87% 2.49% 7.58% -9.86% -10.89% 4.37% 4.24% -5.46% 8.70% -2.60% 0.22% 5.96% 0.74% -0.22% -0.04% -3.46% 0.87% 0.00179 4.23% Materials XLB 0.51% 2.05% -0.19% 3.34% -0.77% -2.26% -8.75% 3.80% -7.49% 6.29% 3.19% 0.82% 3.96% -8.18% 10.90% 0.32% -2.83% 2.66% 0.49% 3.18% 2.30% -5.65% -8.52% -14.57% 15.96% 6.88% 1.62% 7.70% 4.36% 1.03% -0.26% 12.36% 1.97% -1.93% 7.96% 1.21% 0.00390 6.24% 1.41% 0.18% 1.27% 6.95% 4.33% 2.55% -6.42% 8.08% -9.76% 5.28% 1.08% 0.11% -2.35% -2.22% 6.14% -1.20% -0.59% -0.52% 5.56% 5.00% 2.38% -1.63% -6.59% -4.35% 13.13% 3.29% -2.85% 5.90% 2.59% -2.57% -3.24% 7.95% 3.37% 1.82% -0.25% 1.25% 0.00223 4.72% Industrials XLI -2.39% 3.07% -3.77% 7.82% 0.23% 1.69% -10.44% 3.81% -11.21% 12.12% 6.37% -1.72% 4.57% -7.64% 7.45% 0.95% -2.65% 2.47% 1.67% 4.50% -0.69% 0.05% -9.90% -19.25% 9.66% 5.39% 1.52% 4.87% 8.48% -1.07% -1.06% 16.03% 0.59% -3.87% 10.04% 1.08% 0.00508 7.13% 0.37% 6.78% -0.62% 2.45% 6.60% -0.36% -7.69% -1.96% -8.77% 7.40% 6.91% 4.43% 6.71% -8.66% 8.55% 3.86% -1.54% 1.26% 4.22% 5.37% 3.98% 4.33% -7.30% -9.05% 14.33% 7.18% 6.66% 5.98% 11.88% -5.54% -4.79% 11.38% 5.30% -0.61% 4.48% 2.39% 0.00382 6.18% Telecom XTL 1.96% 1.19% 2.21% -0.72% 7.96% -1.05% -7.73% 0.86% - 11.26% 9.38% 5.55% -2.12% 3.75% -10.86% 3.74% 5.44% -6.03% 0.39% 1.03% 2.10% 1.23% -1.81% -4.08% -9.99% 13.27% 4.10% 0.24% 8.73% -1.63% -9.27% 1.00% 15.73% 7.66% 9.08% 3.02% 1.23% 0.00420 6.48% Real Estate Clean Energy Row # XLRE 1 -0.03% -0.60% 2 2.23% 6.58% 3 3.58% -4.95% 4 1.90% 1.83% 5 2.42% 2.42% 6 -3.66% -4.02% 7 -0.56% -6.01% 8 5.48% 5.13% 9 -8.42% -12.34% 10 12.04% 19.92% 11 1.11% 10.23% 12 4.35% -4.76% 13 0.05% 5.60% 14 1.22% -5.09% 15 0.82% 10.65% 16 2.55% 3.01% 17 4.81% -3.71% 18 0.33% -0.48% 19 0.64% 0.01% 20 -1.73% 7.34% 21 0.05% 9.89% 22 2.55% 5.61% 23 -6.22% 4.62% 24 -15.74% -28.73% 25 10.24% 19.76% 26 2.15% 9.05% 27 0.46% 16.62% 28 4.97% 14.65% 29 -0.03% 22.05% 30 -2.70% 7.03% 31 -2.59% 4.18% 32 6.88% 45.10% 33 0.16% 12.53% 34 1.85% 15.90% 35 5.09% -4.42% 36 1.04% 5.27% 0.00242 0.01489 4.92% 12.20% 7.57% 9.55% -2.07% -2.52% 10.00% 2.24% 0.95% 2.88% 1.74% 0.00409 6.40% 1.66% -1.00% 7.76% 4.59% -2.26% -2.29% 7.47% 0.81% -4.19% 1.50% 0.93% 0.00170 4.13% Prices Prices 22.53 Financials XLF 25.85 25.83 25.57 25.02 26.41 26.77 26.06 24.94 25.60 22.61 24.77 25.33 24.55 26.90 24.97 26.49 Date 3/1/2018 4/1/2018 5/1/2018 6/1/2018 7/1/2018 8/1/2018 9/1/2018 10/1/2018 11/1/2018 12/1/2018 1/1/2019 2/1/2019 3/1/2019 4/1/2019 5/1/2019 6/1/2019 7/1/2019 8/1/2019 9/1/2019 10/1/2019 11/1/2019 12/1/2019 1/1/2020 2/1/2020 3/1/2020 4/1/2020 5/1/2020 6/1/2020 7/1/2020 8/1/2020 9/1/2020 10/1/2020 11/1/2020 12/1/2020 1/1/2021 2/1/2021 S&P 500, Large Cap S&P Mid Cap SPY MDY 248.80 328.03 251.09 327.66 257.19 341.16 257.51 341.63 268.25 348.42 276.81 359.44 277.21 354.58 259.22 321.42 264.03 331.67 239.38 292.89 260.06 324.38 268.49 338.40 272.15 335.66 284.51 349.87 266.37 321.64 283.53 345.47 289.21 350.04 284.37 335.58 288.57 344.71 296.31 349.73 307.04 359.96 314.41 368.54 315.83 360.19 290.83 326.31 253.02 259.09 286.83 296.86 300.50 318.37 304.49 321.30 323.84 337.43 346.44 349.14 332.14 336.65 325.15 345.08 360.52 394.41 372.29 418.47 370.07 391.77 469.79 Invest. Russell 2000, Total Bond Grade Corp. High Yield Small Cap Market Bond Corp. Bond IWM BND LOD HYG 145.96 73.67 106.52 73.41 147.73 73.02 104.85 73.76 156.84 73.53 105.40 73.78 157.80 73.49 104.86 73.83 159.83 73.64 106.28 75.07 167.32 74.13 106.30 75.62 163.00 73.72 106.15 76.02 145.47 73.09 103.97 74.50 147.98 73.54 103.57 74.17 129.83 74.74 105.18 72.31 145.02 75.94 109.41 76.59 152.53 75.69 108.86 77.16 148.94 77.17 112.04 78.17 154.41 77.14 112.54 78.95 142.28 78.55 114.40 77.43 151.68 79.53 118.10 79.85 153.26 79.65 118.43 79.98 145.70 81.86 123.04 80.55 148.15 81.40 122.12 80.90 152.70 81.66 122.67 80.91 158.91 81.63 123.24 81.36 162.74 81.39 123.57 82.64 158.27 83.36 127.27 82.87 144.27 84.57 128.33 81.46 112.85 83.37 120.22 73.28 128.98 85.65 126.06 76.81 137.48 86.25 129.17 79.11 141.71 86.83 131.92 78.70 146.34 88.10 136.03 82.66 154.36 87.28 133.63 82.65 148.76 87.20 133.04 81.88 152.61 86.71 132.36 82.19 180.46 87.76 137.36 84.95 195.45 87.62 137.30 86.28 205.56 135.33 227.00 85.81 132.38 87.21 Total World Stock VT 68.80 69.34 69.73 68.81 71.31 71.93 71.64 66.35 67.50 62.14 67.62 69.52 69.99 72.70 68.36 72.18 72.72 71.19 72.39 74.84 76.76 FTSE Europe VGK 52.53 53.92 52.61 50.95 53.73 52.21 52.04 48.12 47.79 45.18 48.52 50.05 50.15 52.41 49.44 51.65 51.21 50.37 51.34 53.64 54.33 56.46 55.03 FTSE Emerging Markets vwo 43.26 42.14 41.15 38.93 40.74 39.03 38.07 35.56 37.28 35.78 39.51 39.36 40.19 41.13 38.51 40.30 39.84 38.54 38.41 40.43 40.64 Cons. Staples XLP 48.37 46.63 45.90 47.63 49.90 50.09 50.23 51.60 52.77 47.63 50.54 51.44 53.11 54.93 52.93 55.27 57.00 58.23 58.91 59.00 59.81 60.76 61.45 56.40 52.98 56.99 57.94 57.36 61.81 64.65 63.19 61.74 66.35 66.89 64.09 65.05 Cons. Disc XLY 97.61 100.22 102.21 105.63 107.82 113.32 113.59 102.42 104.95 96.23 106.14 107.53 111.08 117.55 108.61 116.70 118.60 117.48 118.58 119.12 120.69 123.62 123.93 114.55 96.99 115.87 123.41 126.91 136.46 149.49 146.40 142.71 156.97 160.48 162.01 166.68 27.26 Energy XLE 57.46 63.37 65.26 65.20 66.66 64.34 65.46 58.45 57.53 49.91 56.02 57.32 58.08 58.53 52.03 56.40 56.01 51.35 52.89 52.25 53.09 54.13 50.10 42.44 27.25 36.42 37.15 36.28 34.98 34.61 29.08 28.34 36.27 37.40 39.32 50.29 Utilities XLU 45.72 47.01 46.49 47.37 48.56 49.19 48.43 49.83 51.60 49.12 51.26 53.36 54.45 55.36 54.93 56.23 56.60 59.48 61.54 61.54 60.39 61.90 66.59 60.03 53.49 55.83 58.20 55.02 59.81 58.25 58.38 61.86 62.31 62.17 62.15 60.00 Materials XLB 53.50 53.77 54.87 54.77 56.60 56.16 54.89 50.09 51.99 48.10 51.12 52.75 53.19 55.29 50.77 56.30 56.48 54.89 56.35 56.62 58.42 59.76 56.39 51.58 44.07 51.10 54.62 55.50 59.78 62.38 63.03 62.87 70.64 72.03 70.64 76.26 Healthcare XLV 77.00 78.09 78.23 79.23 84.74 88.40 90.66 84.85 91.70 82.75 87.12 88.07 88.16 86.09 84.18 89.35 88.28 87.75 87.30 92.15 96.76 99.07 97.45 91.04 87.07 98.51 101.75 98.85 104.68 107.39 104.63 101.24 109.29 112.97 115.03 114.74 Industrials XLI 70.00 68.32 70.42 67.76 73.06 73.23 74.47 66.69 69.23 61.47 68.92 73.31 72.05 75.35 69.59 74.78 75.49 73.49 75.30 76.56 80.00 79.45 79.49 71.62 57.83 63.42 66.83 67.85 71.16 77.19 76.37 75.56 87.67 88.19 84.77 93.28 Info Tech XLK 62.86 63.09 67.37 66.96 68.59 73.12 72.86 67.26 65.94 60.15 64.60 69.07 72.13 76.97 70.30 76.31 79.26 78.04 79.02 82.36 86.78 Telecom XTL 66.40 67.70 68.50 70.01 69.51 75.04 74.25 68.51 69.10 61.32 67.08 70.80 69.30 71.90 64.09 66.49 70.11 65.88 66.14 66.82 68.22 69.06 67.81 65.04 58.54 66.31 69.03 69.20 75.24 74.01 67.15 67.82 78.49 84.50 92.18 94.96 Real Estate Clean Energy XLRE PBW 28.08 23.78 28.07 23.64 28.70 25.19 29.72 23.94 30.29 24.38 31.02 24.97 29.88 23.97 29.72 31.35 23.68 28.71 20.76 32.17 24.90 32.52 27.44 33.94 26.13 33.95 27.60 34.37 26.19 34.65 28.98 35.53 29.86 37.24 28.75 37.37 28.61 37.61 28.61 36.96 30.71 36.97 33.75 37.92 35.64 37.29 29.96 26.57 33.03 31.82 33.74 34.70 33.90 40.47 35.58 46.40 35.57 56.63 34.61 60.61 33.71 63.14 36.03 91.62 36.09 103.10 36.76 119.49 38.63 114.21 78.81 42.96 90.24 50.65 35.56 78.17 72.53 61.57 68.23 71.78 73.63 77.90 82.58 79.76 78.52 88.23 92.03 92.37 97.86 41.94 44.93 47.56 49.09 51.24 53.45 51.49 48.97 57.00 59.49 59.70 62.99 41.10 39.64 32.82 35.45 36.62 38.83 42.34 43.50 42.56 43.55 47.27 49.81 51.68 54.43 25.97 27.02 27.83 29.24 29.85 29.20 25.92 20.29 22.40 23.01 22.75 23.77 24.79 23.81 23.73 27.73 29.32 28.95 33.55 94.15 87.27 79.37 90.75 97.26 103.73 109.93 122.99 116.17 110.60 123.19 129.72 128.93 134.71 425.96 87.29 86.65 Column # 1 5 6 Row # Stock Portfolio Summary Statistics 3 4 Opportunity Set Table W(0) R(P) Ticker ETFs Date 0 0 Sharpe Ratio W(0) Var (P) St. Dev. (P) SPY MDY 1 2 3 4 Average Variance St. Dev. IWM 5 6 Covariance Correlation 1 0.9 0.8 0.7 0.6 0.5 0.4 0.3 0.2 0.1 7 0 0.1 0.2 0.3 0.4 0.5 0.6 0.7 0.8 0.9 1 8 9 Rf = 0.007% 10 11 S&P 500, Large Cap S&P Mid Cap Russell 2000, Small Cap Total Bond Market Invest. Grade Corp. Bond High Yield Corp. Bond Total World Stock FTSE Europe FTSE Emerging Markets Cons. Disc Cons. Staples Energy Financials Utilities Materials Healthcare Industrials Info Tech Telecom Real Estate Clean Energy BND LQD HYG VT VGK VWO XLY XLP XLE XLF XLU XLB XLV XLI XLK XTL XLRE PBW 0 12 13 14 15 16 17 Optimal Risky Portfolio W(0) R(P) Sharpe Ratio W(0) Var (P) St. Dev. (P) 18 19 4/1/2018 5/1/2018 6/1/2018 7/1/2018 8/1/2018 9/1/2018 10/1/2018 11/1/2018 12/1/2018 1/1/2019 2/1/2019 3/1/2019 4/1/2019 5/1/2019 6/1/2019 7/1/2019 8/1/2019 ORP -> 9/1/2019 Rf -> 10/1/2019 11/1/2019 12/1/2019 1/1/2020 2/1/2020 3/1/2020 4/1/2020 5/1/2020 6/1/2020 7/1/2020 8/1/2020 9/1/2020 10/1/2020 11/1/2020 12/1/2020 1/1/2021 2/1/2021 20 21 22 23 24 25 26 27 28 29 30 31 32 33 34 35 36
Step by Step Solution
There are 3 Steps involved in it

Get step-by-step solutions from verified subject matter experts