

Question: Answer all using simple python code please!! csv will be Electric_Vehicle_Population_Data.csv Task-2: Make a bar plot for the top ten makers and their vehicle counts
Answer all using simple python code please!! csv will be Electric_Vehicle_Population_Data.csv
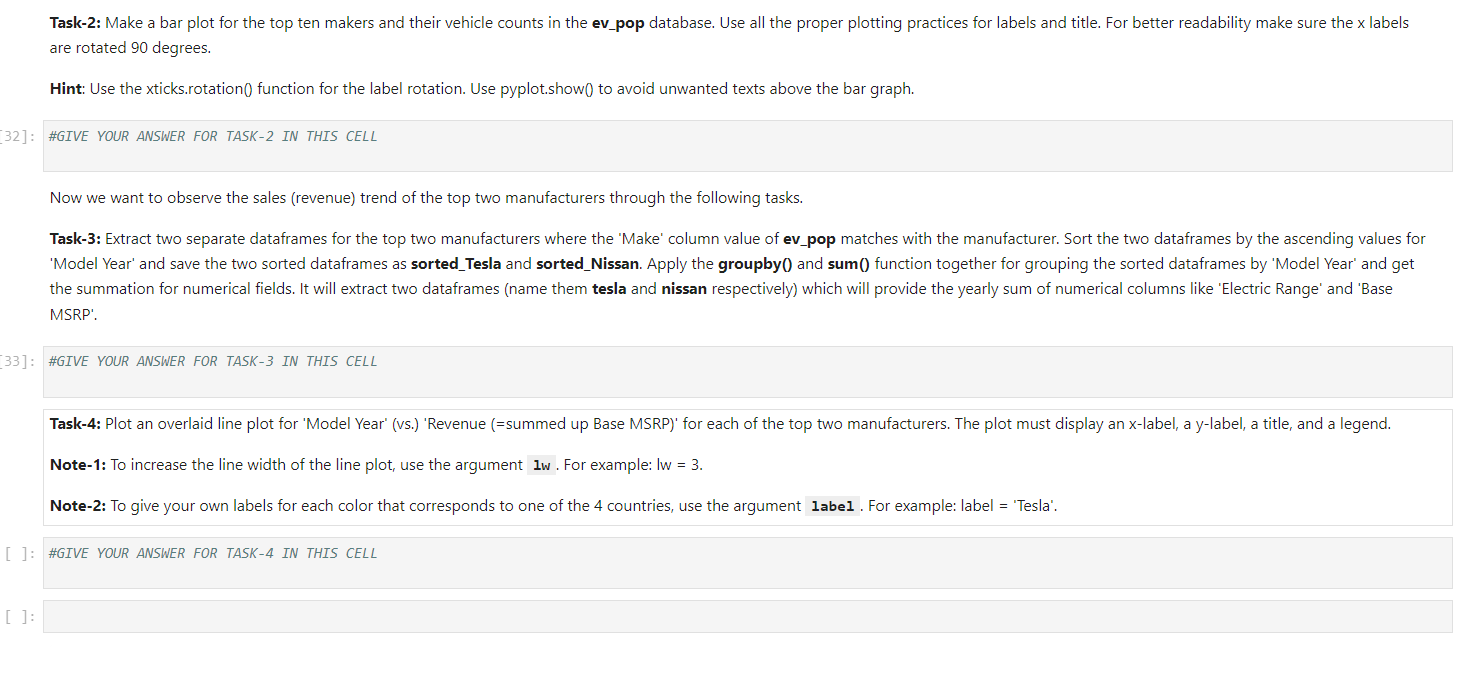
Task-2: Make a bar plot for the top ten makers and their vehicle counts in the ev_pop database. Use all the proper plotting practices for labels and title. For better readability make sure the x labels are rotated 90 degrees. Hint: Use the xticks.rotation 0 function for the label rotation. Use pyplot.show0 to avoid unwanted texts above the bar graph. \#GIVE YOUR ANSWER FOR TASK-2 IN THIS CELL Now we want to observe the sales (revenue) trend of the top two manufacturers through the following tasks. Task-3: Extract two separate dataframes for the top two manufacturers where the 'Make' column value of ev_pop matches with the manufacturer. Sort the two dataframes by the ascending values for 'Model Year' and save the two sorted dataframes as sorted_Tesla and sorted_Nissan. Apply the groupby() and sum() function together for grouping the sorted dataframes by 'Model Year' and get the summation for numerical fields. It will extract two dataframes (name them tesla and nissan respectively) which will provide the yearly sum of numerical columns like 'Electric Range' and 'Base MSRP'. \#GIVE YOUR ANSWER FOR TASK-3 IN THIS CELL Task-4: Plot an overlaid line plot for 'Model Year' (vs.) 'Revenue (=summed up Base MSRP)' for each of the top two manufacturers. The plot must display an x-label, a y-label, a title, and a legend. Note-1: To increase the line width of the line plot, use the argument 1w. For example: Iw = 3. Note-2: To give your own labels for each color that corresponds to one of the 4 countries, use the argument label . For example: label = 'Tesla
Step by Step Solution
There are 3 Steps involved in it

Get step-by-step solutions from verified subject matter experts