

Question: Please Help with all PLease!!. Please use simple python code! Exercise-2: In this exercise, we shall visualize the data from the manufacturer's perspective through following
 Please Help with all PLease!!. Please use simple python code!
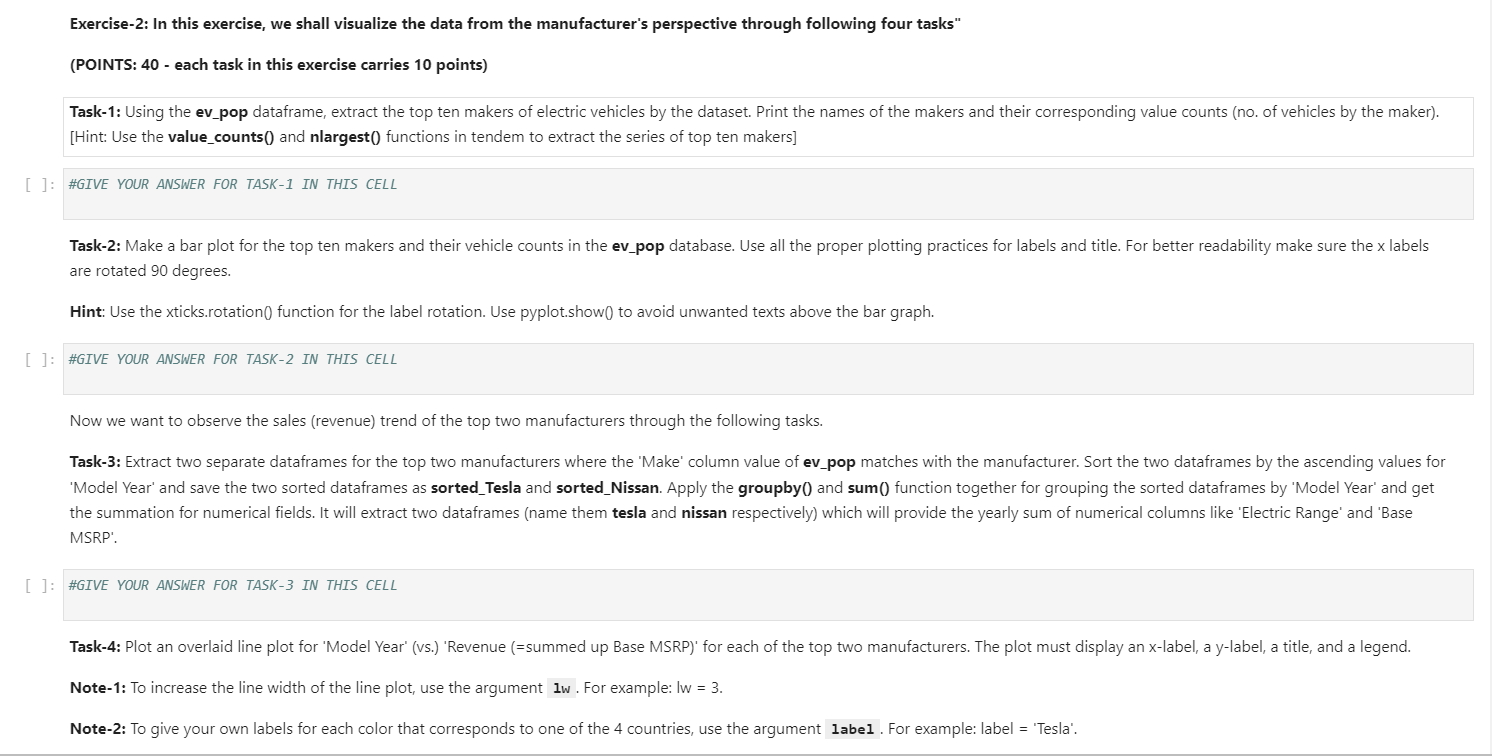
Exercise-2: In this exercise, we shall visualize the data from the manufacturer's perspective through following four tasks" (POINTS: 40 - each task in this exercise carries 10 points) [Hint: Use the value_counts() and nlargest() functions in tendem to extract the series of top ten makers] ]: \#GIVE YOUR ANSWER FOR TASK-1 IN THIS CELL are rotated 90 degrees. Hint: Use the xticks.rotation( function for the label rotation. Use pyplot.show0 to avoid unwanted texts above the bar graph. \#GIVE YOUR ANSWER FOR TASK-2 IN THIS CELL Now we want to observe the sales (revenue) trend of the top two manufacturers through the following tasks. MSRP'. \#GIVE YOUR ANSWER FOR TASK-3 IN THIS CELL Note-1: To increase the line width of the line plot, use the argument Iw. For example: Iw =3. Note-2: To give your own labels for each color that corresponds to one of the 4 countries, use the argument label. For example: label = 'Tesla
Step by Step Solution
There are 3 Steps involved in it

Get step-by-step solutions from verified subject matter experts