

Question: Answer both a) b) Question 2 (a) SERVQUAL is a survey tool that was designed in the late 1980s that measures the customer's perception of
Answer both a) b)
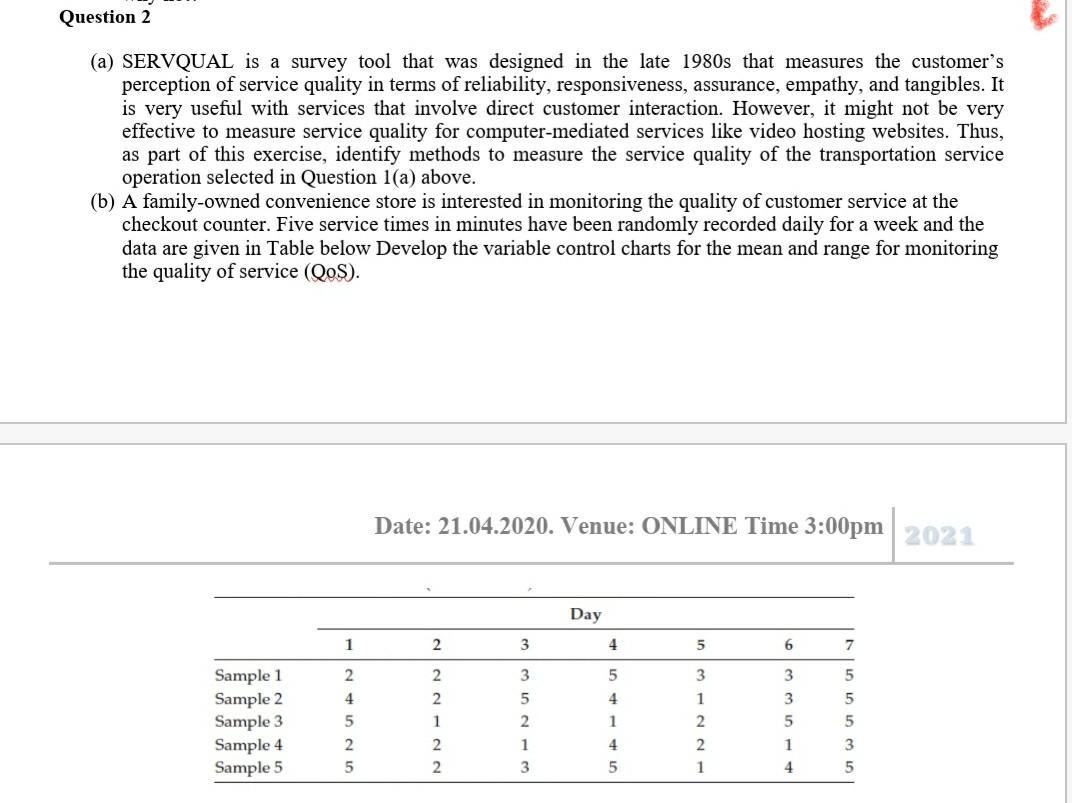
Question 2 (a) SERVQUAL is a survey tool that was designed in the late 1980s that measures the customer's perception of service quality in terms of reliability, responsiveness, assurance, empathy, and tangibles. It is very useful with services that involve direct customer interaction. However, it might not be very effective to measure service quality for computer-mediated services like video hosting websites. Thus, as part of this exercise, identify methods to measure the service quality of the transportation service operation selected in Question 1(a) above. (b) A family-owned convenience store is interested in monitoring the quality of customer service at the checkout counter. Five service times in minutes have been randomly recorded daily for a week and the data are given in Table below Develop the variable control charts for the mean and range for monitoring the quality of service (Qo$). Date: 21.04.2020. Venue: ONLINE Time 3:00pm 2021 Day 1 2 3 4 5 6 7 2 2 3 5 3 5 5 1 5 Sample 1 Sample 2 Sample 3 Sample 4 Sample 5 4 5 2 1 2 4 1 4 5 5 3 3 5 1 4 1 2 5 2. 2 1 2 2. 3 5 3 Question 2 (a) SERVQUAL is a survey tool that was designed in the late 1980s that measures the customer's perception of service quality in terms of reliability, responsiveness, assurance, empathy, and tangibles. It is very useful with services that involve direct customer interaction. However, it might not be very effective to measure service quality for computer-mediated services like video hosting websites. Thus, as part of this exercise, identify methods to measure the service quality of the transportation service operation selected in Question 1(a) above. (b) A family-owned convenience store is interested in monitoring the quality of customer service at the checkout counter. Five service times in minutes have been randomly recorded daily for a week and the data are given in Table below Develop the variable control charts for the mean and range for monitoring the quality of service (Qo$). Date: 21.04.2020. Venue: ONLINE Time 3:00pm 2021 Day 1 2 3 4 5 6 7 2 2 3 5 3 5 5 1 5 Sample 1 Sample 2 Sample 3 Sample 4 Sample 5 4 5 2 1 2 4 1 4 5 5 3 3 5 1 4 1 2 5 2. 2 1 2 2. 3 5 3Step by Step Solution
There are 3 Steps involved in it
1 Expert Approved Answer
Step: 1 Unlock

Question Has Been Solved by an Expert!
Get step-by-step solutions from verified subject matter experts
Step: 2 Unlock
Step: 3 Unlock