

Question: answer d and e 1. Below is the actual price and dividend data for three companies for each of seven months. Note that a dividend
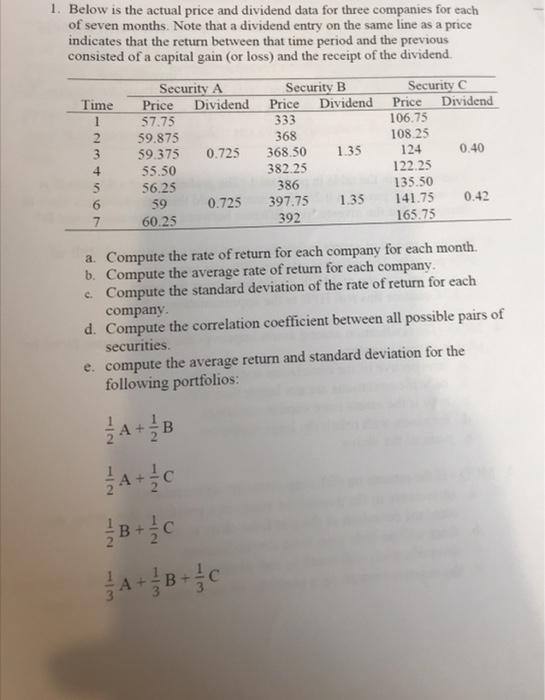
1. Below is the actual price and dividend data for three companies for each of seven months. Note that a dividend entry on the same line as a price indicates that the return between that time period and the previous consisted of a capital gain (or loss) and the receipt of the dividend. a. Compute the rate of return for each company for each month. b. Compute the average rate of return for each company. c. Compute the standard deviation of the rate of return for each company. d. Compute the correlation coefficient between all possible pairs of securities. e. compute the average return and standard deviation for the following portfolios: 21A+21B21A+21C21B+21C31A+31B+31C 1. Below is the actual price and dividend data for three companies for each of seven months. Note that a dividend entry on the same line as a price indicates that the return between that time period and the previous consisted of a capital gain (or loss) and the receipt of the dividend. a. Compute the rate of return for each company for each month. b. Compute the average rate of return for each company. c. Compute the standard deviation of the rate of return for each company. d. Compute the correlation coefficient between all possible pairs of securities. e. compute the average return and standard deviation for the following portfolios: 21A+21B21A+21C21B+21C31A+31B+31C
Step by Step Solution
There are 3 Steps involved in it

Get step-by-step solutions from verified subject matter experts