

Question: answer fast I up vote Question 2-12 points The following plot depicts cumulative abnormal returns over 36 months following an announcement for firms that initiated
answer fast I up vote
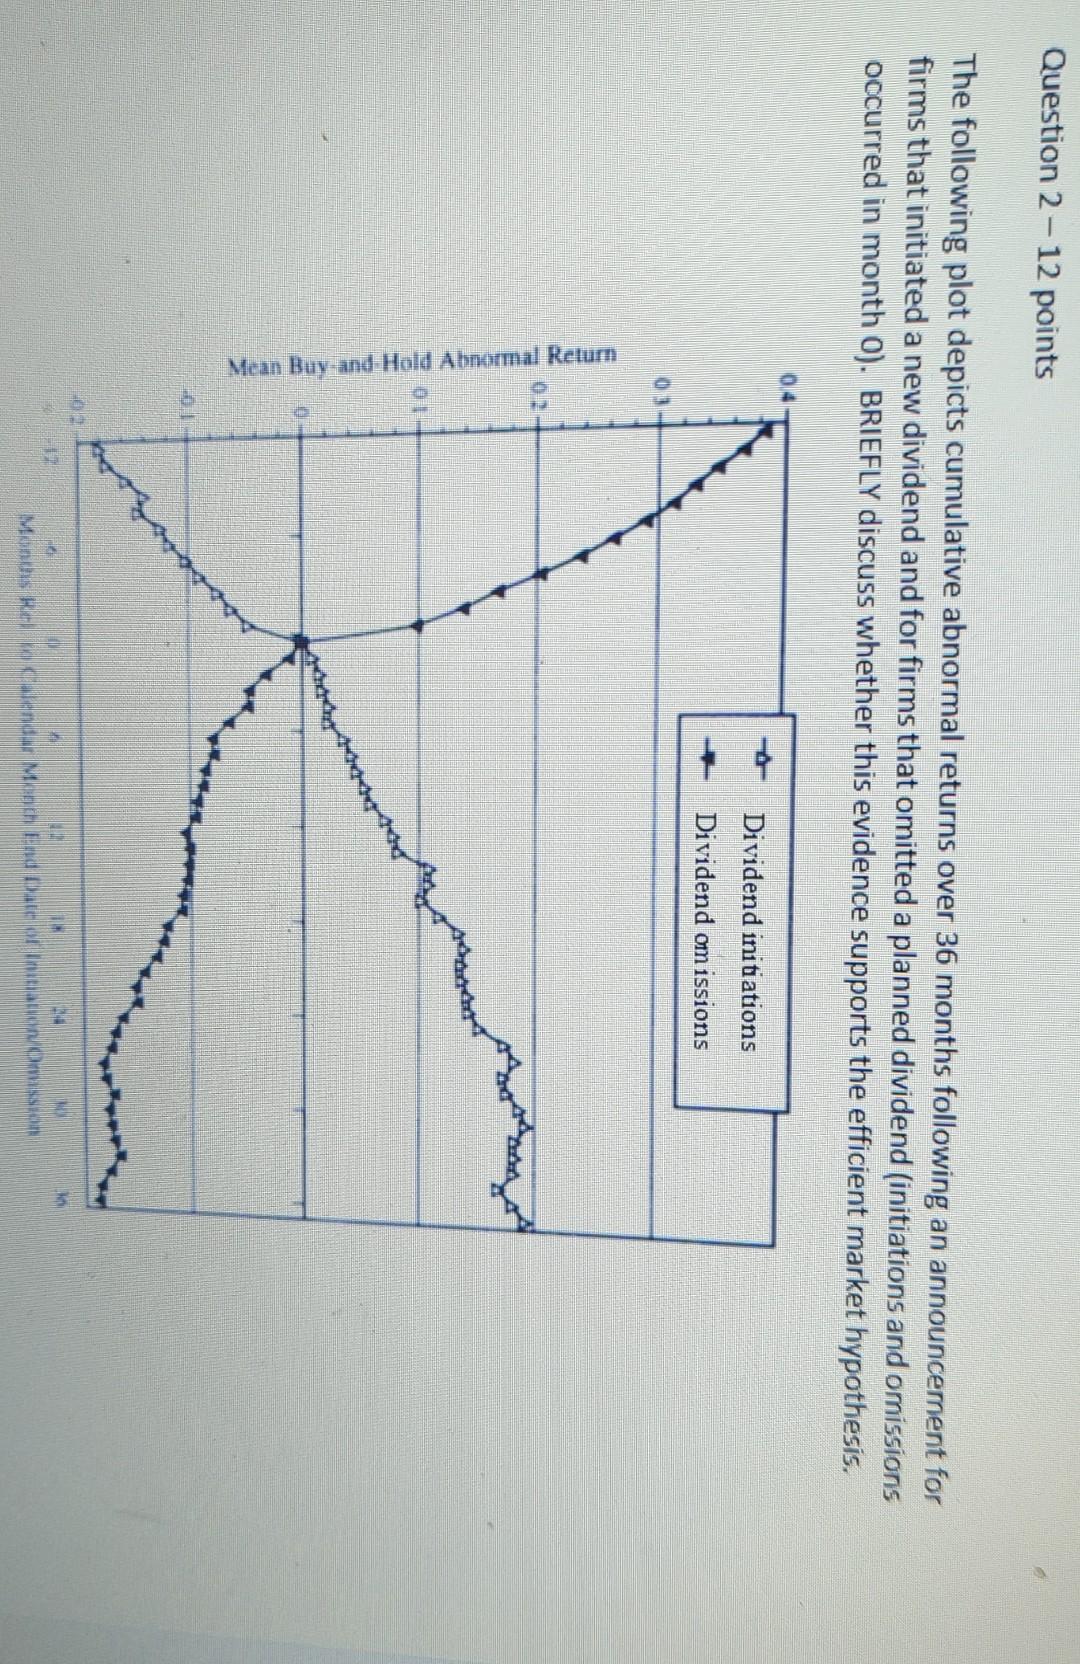
Question 2-12 points The following plot depicts cumulative abnormal returns over 36 months following an announcement for firms that initiated a new dividend and for firms that omitted a planned dividend (initiations and omissions occurred in month 0). BRIEFLY discuss whether this evidence supports the efficient market hypothesis. Dividend initiations Dividend omissions 03 Mean Buy and Hald Abnormal Return Argan Mons Halendar Month Date Son Question 2-12 points The following plot depicts cumulative abnormal returns over 36 months following an announcement for firms that initiated a new dividend and for firms that omitted a planned dividend (initiations and omissions occurred in month 0). BRIEFLY discuss whether this evidence supports the efficient market hypothesis. Dividend initiations Dividend omissions 03 Mean Buy and Hald Abnormal Return Argan Mons Halendar Month Date Son
Step by Step Solution
There are 3 Steps involved in it

Get step-by-step solutions from verified subject matter experts