

Question: Answer fast please The following plot depicts cumulative abnormal returns over 36 months following an announcement for firms that initiated a new dividend and for
Answer fast please
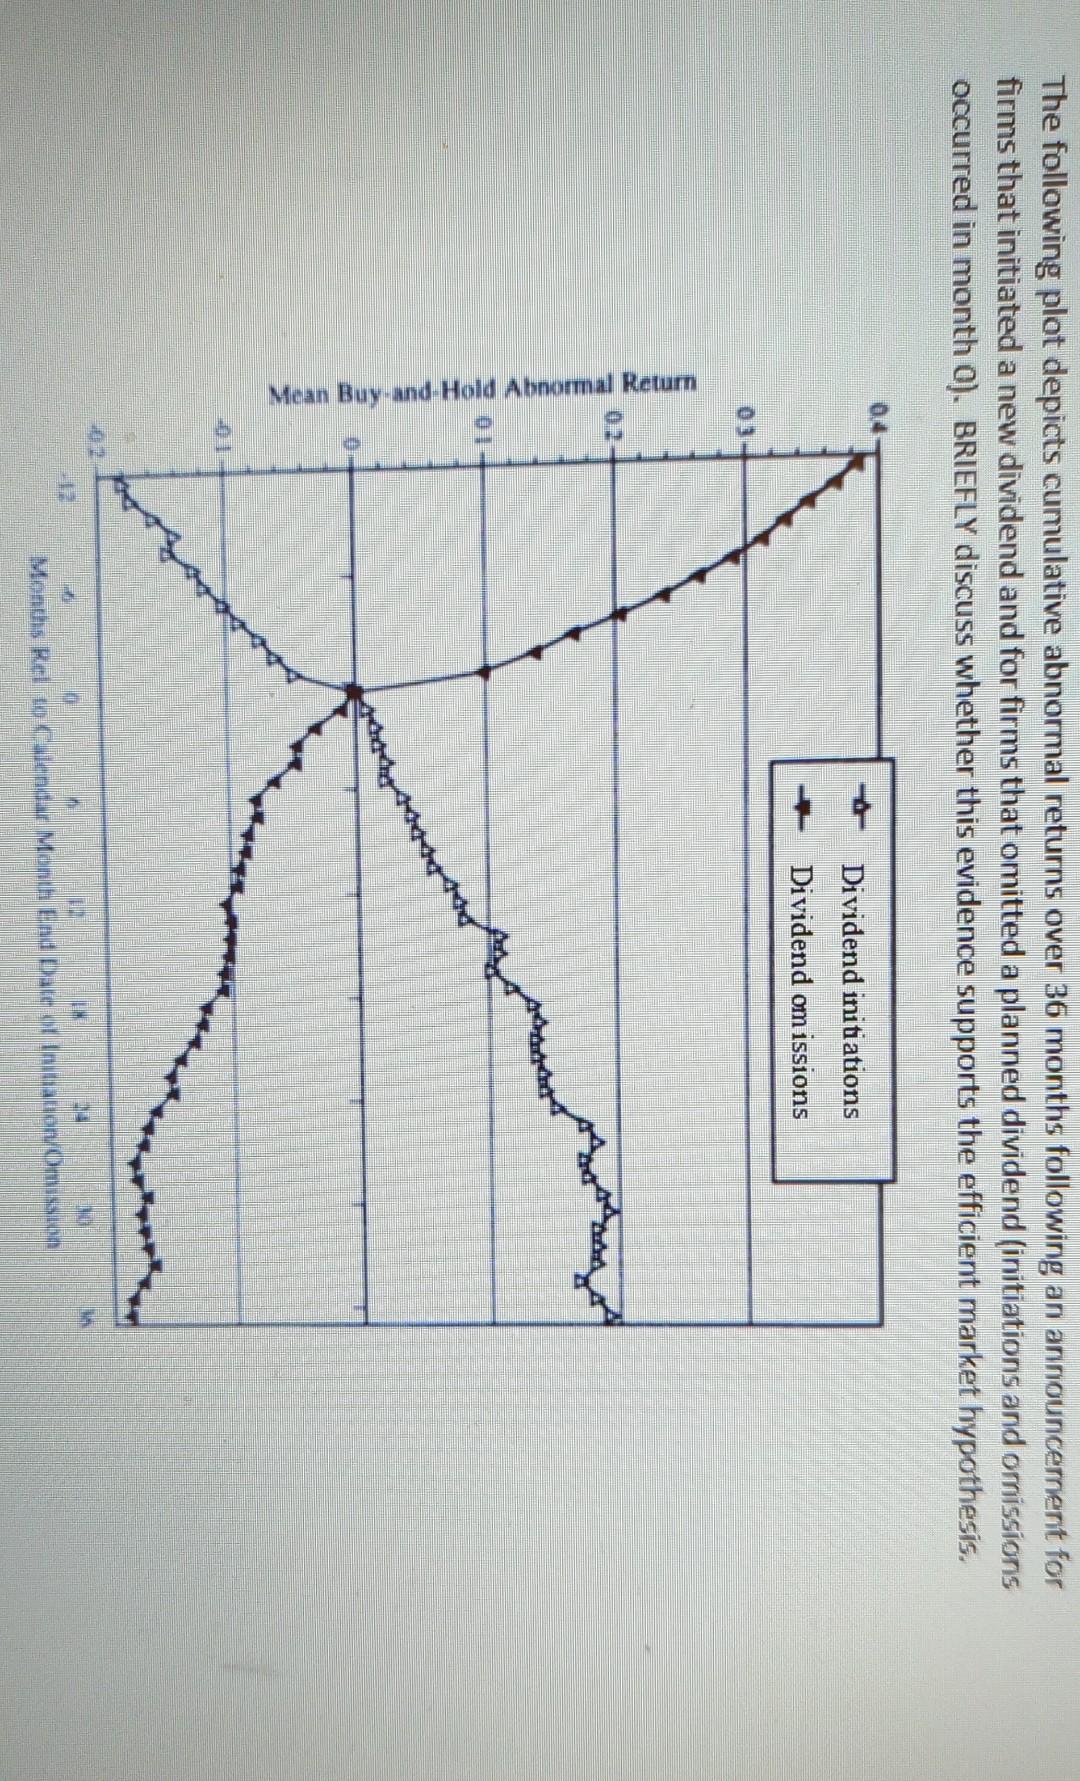
The following plot depicts cumulative abnormal returns over 36 months following an announcement for firms that initiated a new dividend and for firms that omitted a planned dividend (initiations and omissions occurred in month O). BRIEFLY discuss whether this evidence supports the efficient market hypothesis. 04 Dividend initiations Dividend om issions Mean Buy-and-Hold Abnomal Retum IN Months Reloc endar Month End Date olin tauon/Omission The following plot depicts cumulative abnormal returns over 36 months following an announcement for firms that initiated a new dividend and for firms that omitted a planned dividend (initiations and omissions occurred in month O). BRIEFLY discuss whether this evidence supports the efficient market hypothesis. 04 Dividend initiations Dividend om issions Mean Buy-and-Hold Abnomal Retum IN Months Reloc endar Month End Date olin tauon/Omission
Step by Step Solution
There are 3 Steps involved in it

Get step-by-step solutions from verified subject matter experts