

Question: The following plot depicts cumulative abnormal returns over 36 months following an announcement for firms that initiated a new dividend and for firms that omitted
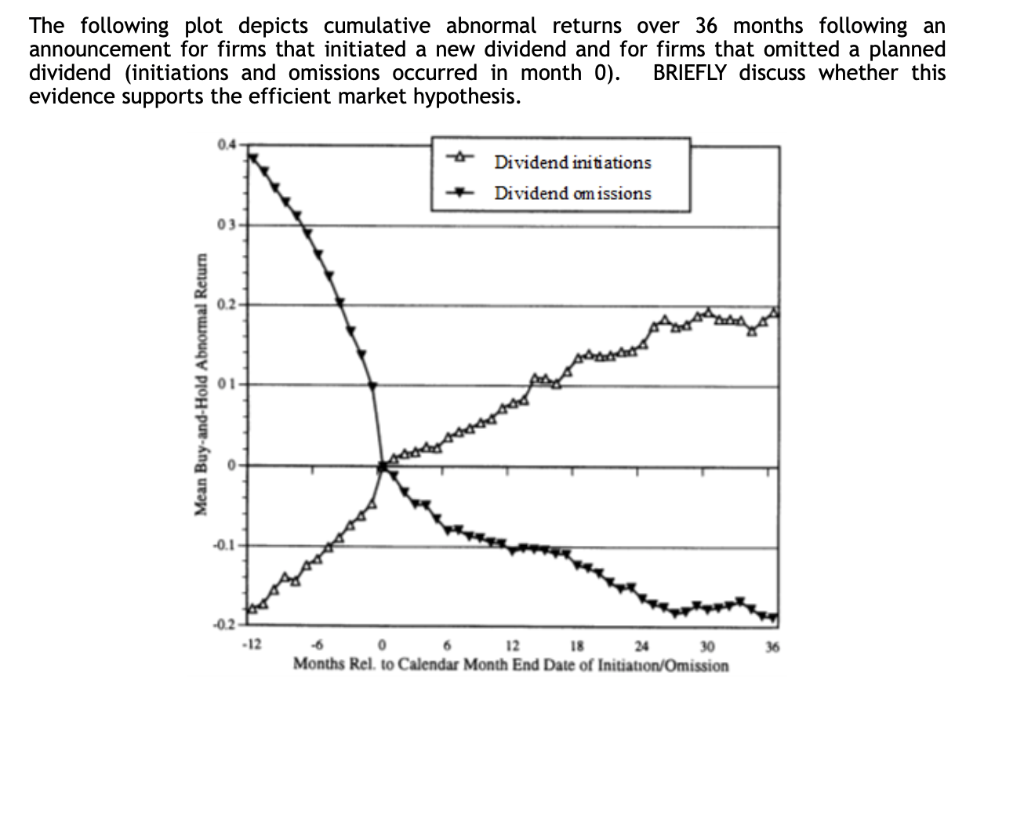
The following plot depicts cumulative abnormal returns over 36 months following an announcement for firms that initiated a new dividend and for firms that omitted a planned dividend initiations and omissions occurred in month 0). BRIEFLY discuss whether this evidence supports the efficient market hypothesis. 0.4 Dividend initiations + Dividend omissions 03- 02- Mean Buy-and-Hold Abnormal Return -0.1 -02 -12 0 6 12 18 30 Months Rel. to Calendar Month End Date of Initiation/Omission The following plot depicts cumulative abnormal returns over 36 months following an announcement for firms that initiated a new dividend and for firms that omitted a planned dividend initiations and omissions occurred in month 0). BRIEFLY discuss whether this evidence supports the efficient market hypothesis. 0.4 Dividend initiations + Dividend omissions 03- 02- Mean Buy-and-Hold Abnormal Return -0.1 -02 -12 0 6 12 18 30 Months Rel. to Calendar Month End Date of Initiation/Omission
Step by Step Solution
There are 3 Steps involved in it

Get step-by-step solutions from verified subject matter experts