

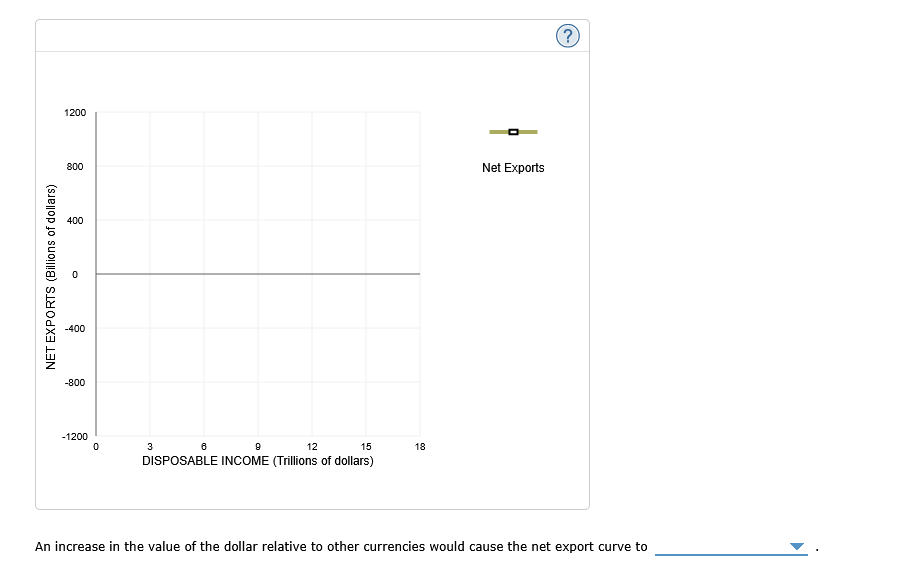
Question: answer graph and question 1200 800 Net Exports 400 0 NET EXPORTS (Billions of dollars) -400 -800 -1200 3 9 12 15 18 DISPOSABLE INCOME
answer graph and question
Step by Step Solution
There are 3 Steps involved in it
1 Expert Approved Answer
Step: 1 Unlock

Question Has Been Solved by an Expert!
Get step-by-step solutions from verified subject matter experts
Step: 2 Unlock
Step: 3 Unlock