

Question: Answer in 4 decimal place Good Express provides all conventional courier services, such as next-day delivery service, same-day delivery service, international express delivery, standard pickup
Answer in 4 decimal place
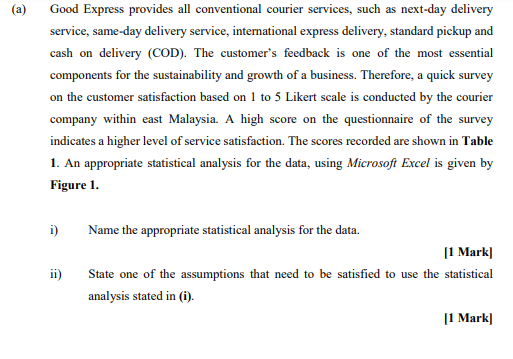
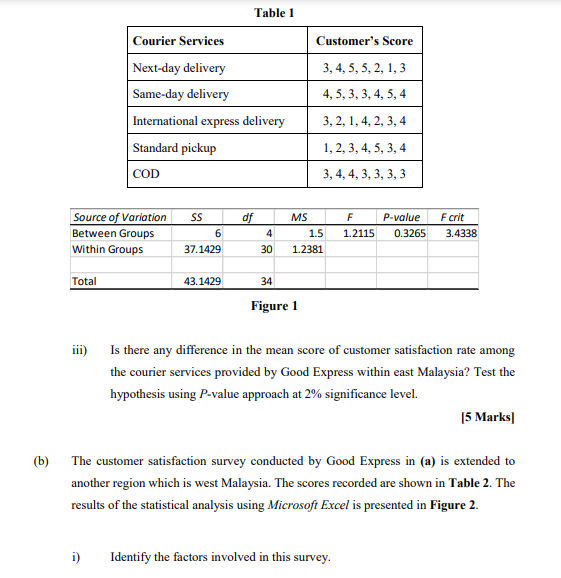
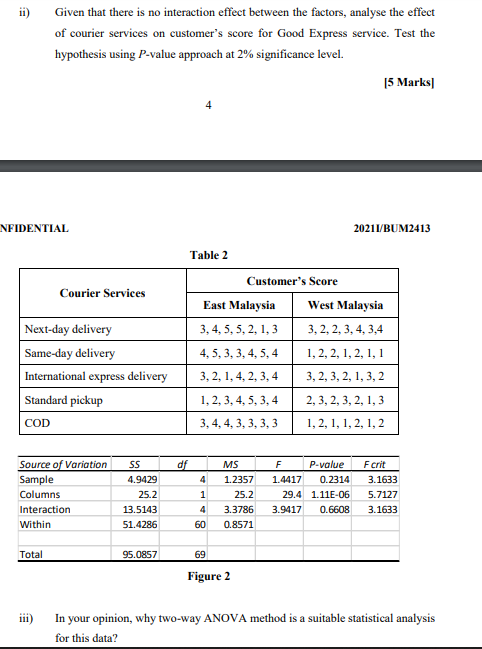
Good Express provides all conventional courier services, such as next-day delivery service, same-day delivery service, international express delivery, standard pickup and cash on delivery (COD). The customer's feedback is one of the most essential components for the sustainability and growth of a business. Therefore, a quick survey on the customer satisfaction based on 1 to 5 Likert scale is conducted by the courier company within east Malaysia. A high score on the questionnaire of the survey indicates a higher level of service satisfaction. The scores recorded are shown in Table 1. An appropriate statistical analysis for the data, using Microsoft Excel is given by Figure 1. i) ii) Name the appropriate statistical analysis for the data. [1 Mark] State one of the assumptions that need to be satisfied to use the statistical analysis stated in (i). [1 Mark] Table 1 Customer's Score Courier Services Next-day delivery Same-day delivery International express delivery Standard pickup COD 3, 4, 5, 5, 2, 1, 3 4, 5, 3, 3, 4, 5,4 3, 2, 1, 4, 2, 3, 4 1, 2, 3, 4, 5, 3, 4 3, 4, 4, 3, 3, 3, 3 df Source of Variation Between Groups Within Groups SS 6 37.1429 MS 1.5 1.2381 F 1.2115 P-value 0.3265 Fcrit 3.4338 4 30 Total 43.1429 34 Figure 1 111) Is there any difference in the mean score of customer satisfaction rate among the courier services provided by Good Express within east Malaysia? Test the hypothesis using P-value approach at 2% significance level. [5 Marks (b) The customer satisfaction survey conducted by Good Express in (a) is extended to another region which is west Malaysia. The scores recorded are shown in Table 2. The results of the statistical analysis using Microsoft Excel is presented in Figure 2. i) Identify the factors involved in this survey. ii) Given that there is no interaction effect between the factors, analyse the effect of courier services on customer's score for Good Express service. Test the hypothesis using P-value approach at 2% significance level. 15 Marks NFIDENTIAL 20211/BUM2413 Table 2 Courier Services Next-day delivery Same-day delivery International express delivery Standard pickup Customer's Score East Malaysia West Malaysia 3, 4, 5, 5, 2, 1, 3 3,2, 2, 3, 4, 3,4 4, 5, 3, 3, 4, 5, 4 1, 2, 2, 1, 2, 1, 1 3, 2, 1, 4, 2, 3, 4 3, 2, 3, 2, 1, 3,2 1, 2, 3, 4, 5, 3, 4 2,3,2,3,2,1,3 3,4,4,3,3,3,3 1, 2, 1, 1, 2, 1, 2 COD df 4 Source of Variation Sample Columns Interaction Within SS 4.9429 25.2 13.5143 51.4286 MS 1.2357 25.2 3.3786 0.8571 F P-value 1.4417 0.2314 29.4 1.11E-06 3.9417 0.6608 Fcrit 3.1633 5.7127 3.1633 1 4 60 Total 95.0857 69 Figure 2 iii) In your opinion, why two-way ANOVA method is a suitable statistical analysis for this data? Good Express provides all conventional courier services, such as next-day delivery service, same-day delivery service, international express delivery, standard pickup and cash on delivery (COD). The customer's feedback is one of the most essential components for the sustainability and growth of a business. Therefore, a quick survey on the customer satisfaction based on 1 to 5 Likert scale is conducted by the courier company within east Malaysia. A high score on the questionnaire of the survey indicates a higher level of service satisfaction. The scores recorded are shown in Table 1. An appropriate statistical analysis for the data, using Microsoft Excel is given by Figure 1. i) ii) Name the appropriate statistical analysis for the data. [1 Mark] State one of the assumptions that need to be satisfied to use the statistical analysis stated in (i). [1 Mark] Table 1 Customer's Score Courier Services Next-day delivery Same-day delivery International express delivery Standard pickup COD 3, 4, 5, 5, 2, 1, 3 4, 5, 3, 3, 4, 5,4 3, 2, 1, 4, 2, 3, 4 1, 2, 3, 4, 5, 3, 4 3, 4, 4, 3, 3, 3, 3 df Source of Variation Between Groups Within Groups SS 6 37.1429 MS 1.5 1.2381 F 1.2115 P-value 0.3265 Fcrit 3.4338 4 30 Total 43.1429 34 Figure 1 111) Is there any difference in the mean score of customer satisfaction rate among the courier services provided by Good Express within east Malaysia? Test the hypothesis using P-value approach at 2% significance level. [5 Marks (b) The customer satisfaction survey conducted by Good Express in (a) is extended to another region which is west Malaysia. The scores recorded are shown in Table 2. The results of the statistical analysis using Microsoft Excel is presented in Figure 2. i) Identify the factors involved in this survey. ii) Given that there is no interaction effect between the factors, analyse the effect of courier services on customer's score for Good Express service. Test the hypothesis using P-value approach at 2% significance level. 15 Marks NFIDENTIAL 20211/BUM2413 Table 2 Courier Services Next-day delivery Same-day delivery International express delivery Standard pickup Customer's Score East Malaysia West Malaysia 3, 4, 5, 5, 2, 1, 3 3,2, 2, 3, 4, 3,4 4, 5, 3, 3, 4, 5, 4 1, 2, 2, 1, 2, 1, 1 3, 2, 1, 4, 2, 3, 4 3, 2, 3, 2, 1, 3,2 1, 2, 3, 4, 5, 3, 4 2,3,2,3,2,1,3 3,4,4,3,3,3,3 1, 2, 1, 1, 2, 1, 2 COD df 4 Source of Variation Sample Columns Interaction Within SS 4.9429 25.2 13.5143 51.4286 MS 1.2357 25.2 3.3786 0.8571 F P-value 1.4417 0.2314 29.4 1.11E-06 3.9417 0.6608 Fcrit 3.1633 5.7127 3.1633 1 4 60 Total 95.0857 69 Figure 2 iii) In your opinion, why two-way ANOVA method is a suitable statistical analysis for this dataStep by Step Solution
There are 3 Steps involved in it
1 Expert Approved Answer
Step: 1 Unlock

Question Has Been Solved by an Expert!
Get step-by-step solutions from verified subject matter experts
Step: 2 Unlock
Step: 3 Unlock