Question: QUESTION 3 |15 MARKS (a) Good Express provides all conventional courier services, such as next-day delivery service, same-day delivery service, international express delivery, standard pickup
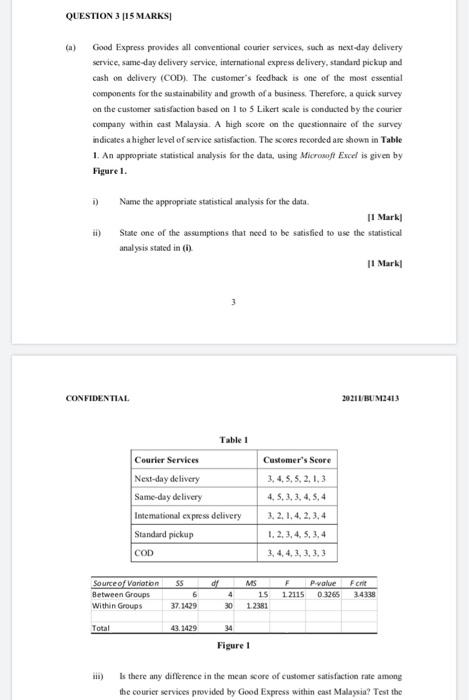
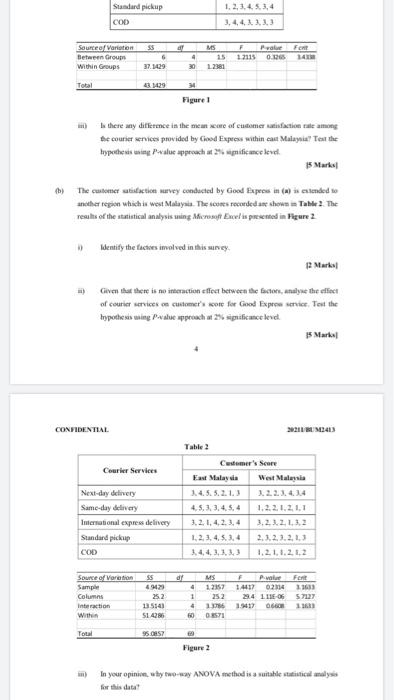
QUESTION 3 |15 MARKS (a) Good Express provides all conventional courier services, such as next-day delivery service, same-day delivery service, international express delivery, standard pickup and cash on delivery (COD). The customer's feedback is one of the most essential components for the sustainability and growth of a business. Therefore, a quick survey on the customer satisfaction based on 1 to 5 Likert scale is conducted by the courier company within cast Malaysia. A high score on the questionnaire of the survey indicates al a higher level of service satisfaction. The scores recorded are shown in Table 1. An appropriate statistical analysis for the data, using Microsoft Excel is given by Figure 1. :) ) Name the appropriate statistical analysis for the data. 11 Marki State one of the assumptions that need to be satisfied to use the statistical analysis stated in (0) 11 Mark! 3 CONFIDENTIAL 20211 BUM2413 Table 1 Courier Services Next-day delivery Same-day delivery Intemational express delivery Standard pickup COD Customer's Score 3.4.5.5.2.1,3 4.5,3,3,4,5,4 3.2.1.4.2.3.4 1. 2. 3. 4. 5.3.4 Source of Variation Between Groups Within Groups SS 6 37.1429 dr 4 30 MS 15 1.2381 F 1 2115 P.value 0.3265 Ferie 34338 Total 43.1429 Figure 1 Is there any difference in the mean score of customer satisfaction rate among the courier services provided by Good Express within cast Malaysia? Test the Sundard pickup COD 1.2.3.4.5.3,4 3, 4413 Source of Variation Between Group within Groups SS dr 6 4 37. 1439 30 MS 15 12381 F 1.2115 Pole 01205 For 14 Total 43.1429 Figure 1 Is there any difference in the mean care of cutomer satisfaction rate among the courier services provided by Good Express within cast Malaysia Test the hypothesis in Palue approach at 2pificance level (h) The customer satisfaction survey conducted by Good Expees in (s) is slended to another region which is west Malaysia. The comes recorded are shown in Table 2 The results of the statistical analysis wing Microsoft Excel is presented in Figure 2 Identify the factores involved in this survey 2 Marks Given that there is no interaction effect between the factors, analyse the effect of courier services customer's scote for Good Expose Tost the hypothesis wing Pabe approach at 23. sificancelled Market CONFIDENTIAL 202013413 Table 2 Courier Services Next-day delivery Same-day delivery International express delivery Standard pickup COD Customer's Sore East Malaysia West Malaysia 3.4.5.5.2.1.3 4.5.3.3.4.5.4 3.2.1, 4.2.3.4 1,2,3,4,5 3,4 2.3.2.3.2, 13 1.2.1.1.2.1.2 of MS 12153 4 Source of Veration Sample Columns Interaction with SS 499 25.2 13514 FP value Fort 14417 0214 3363 23.4 1.11-06 57127 1163 1 4 50 1386 51 4256 Total 95 OS7 Figure 2 In your opin why two-way ANOVA method is a suitable class for this data