

Question: Answer in MATLAB code Example: 2. Plot the following signals on the same window, but separate graphs using the subplot command and axis so that
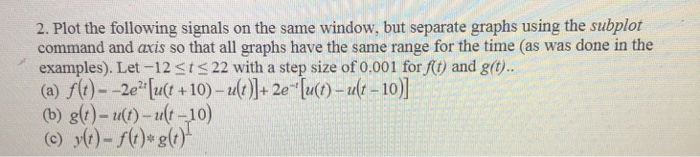
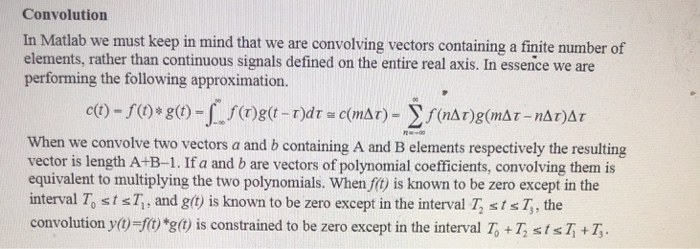
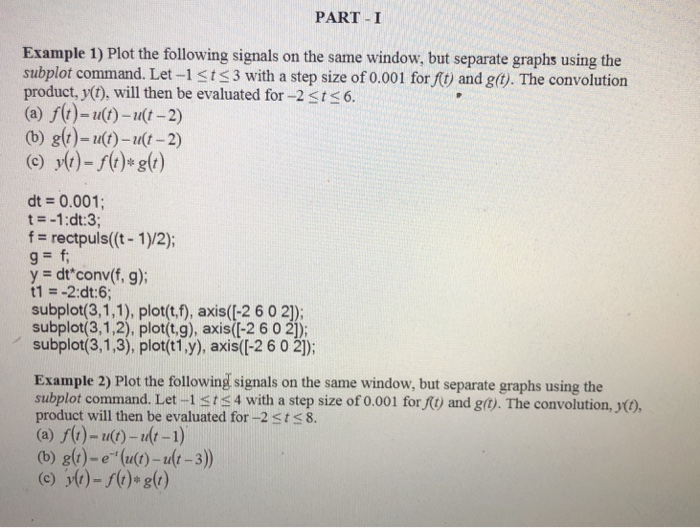
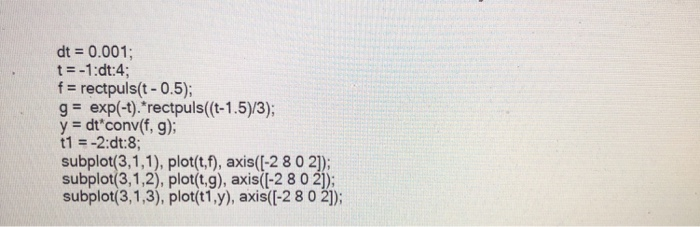
2. Plot the following signals on the same window, but separate graphs using the subplot command and axis so that all graphs have the same range for the time (as was done in the examples). Let-12sts 22 with a step size of 0.001 for f0 and g(t). (b) gt)-)-u-10) Convolution In Matlab we must keep in mind that we are convolving vectors containing a finite number of elements, rather than continuous signals defined on the entire real axis. In essence we are performing the following approximation. When we convolve two vectors a and b containing A and B elements respectively the resulting vector is length A+B-1. If a and b are vectors of polynomial coefficients, convolving them is equivalent to multiplying the two polynomials. When f(t) is known to be zero except in the interval To st sT, and g(t) is known to be zero except in the interval T sts T, the convolution y(t)-ft) *g(t) is constrained to be zero except in the interval T+4 s t sT+T, . PART-I Example 1) Plot the following signals on the same window, but separate graphs using the subplot command. Let-1st s 3 with a step size of 0.001 for ft) and g). The convolution product, y(t), will then be evaluated for-2 sts6 (b) gt)-ut)-ut-2) dt-0.001; t--1:dt:3; f - rectpuls(t- 1)/2) y - dt'conv(f, g); t1-2:dt:6; subplot(3,1,1), plot(t,f), axis([-2 6 0 21); subplot(3,1,2), plot(t,g), axis([-260 21); subplot(3,1,3), plot(t1,y), axis(l-2 6 02); Example 2) Plot the followingl signals on the same window, but separate graphs using the subplot command. Let-1 sts4 with a step size of 0.001 for () and g(t). The convolution, y(). product will then be evaluated for-2 sts8. (b) gt)-e(u()-ut-3)) dt 0.001 t--1:dt:4; f rectpuls(t -0.5); g exp(-t). rectpuls(t-1.5)/3); y - dt'conv(f, g): subplot(3,1,1), plot(t,f), axis(-2 80 2]); subplot(3,1,2), plot(t,g), axis((-2 8 0 2]); subplot(3,1,3), plot(t1,y), axis(I-2 8 0 2])
Step by Step Solution
There are 3 Steps involved in it

Get step-by-step solutions from verified subject matter experts