

Question: Answer Introducing graphing in the candle-buming context. Changes in Quantities In prior problems we have examined a change in a quantity's value from one value
Answer
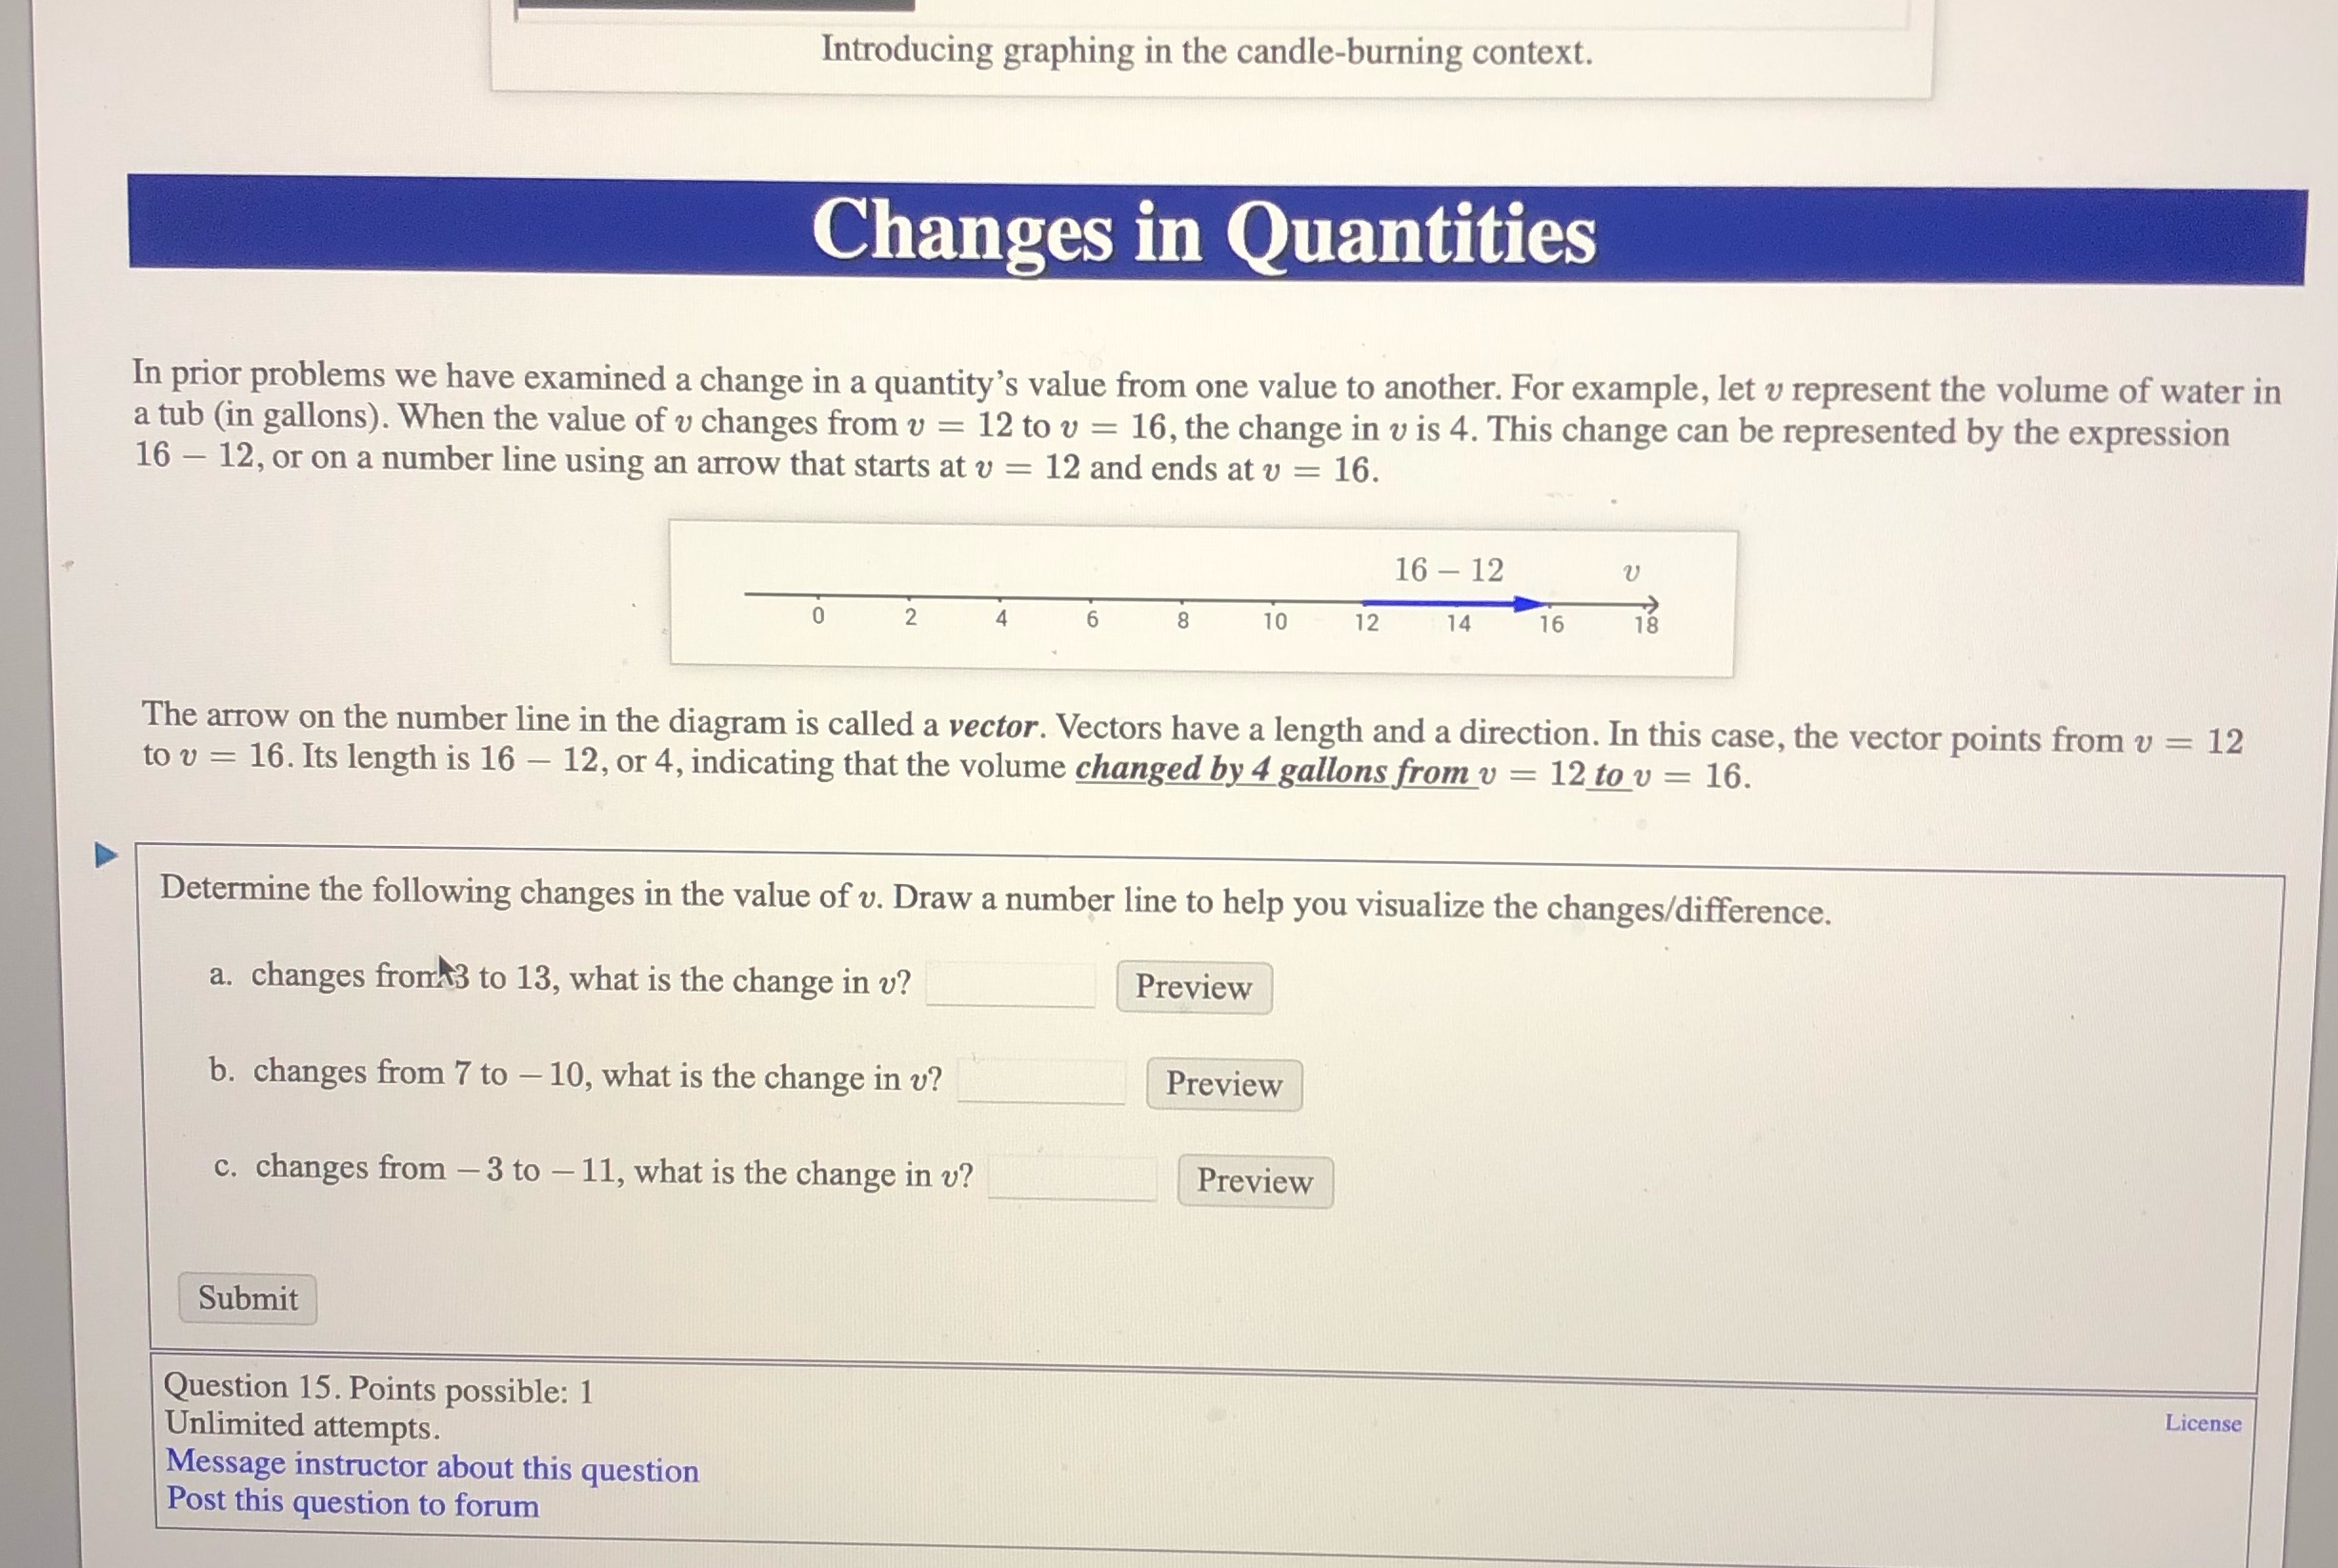
Introducing graphing in the candle-buming context. Changes in Quantities In prior problems we have examined a change in a quantity's value from one value to another. For example, let 1) represent the volume of water in a tub (in gallons). When the value of 1; changes from v = 12 to v = 16, the change in v is 4. This change can be represented by the expression 16 12, or on a number line using an arrow that starts at v = 12 and ends at v = 16. 16~12 l' The arrow on the number line in the diagram is called a vector. Vectors have a length and a direction. In this case, the vector points from v = 12 to v = 16. Its length is 16 12, or 4, indicating that the volume changed by 4 gallons from 11 = 12 to v = 16. Determine the following changes in the value of '0. Draw a number line to help you visualize the changes/difference. a. changes frorrR3 to 13, what is the change in 11? Preview ' b. changes from 7 to 10, what is the change in 11? Preview c. changes from 3 to 11, what is the change in 1)? Preview @El Question 15. Points possible: 1 . License Unlimited attempts. Message instructor about this question Post this question to forum
Step by Step Solution
There are 3 Steps involved in it

Get step-by-step solutions from verified subject matter experts