

Question: I need the answer to #10 based on the information from #9 in my Productions/Operations Management class. 5 . 8 1 2 3 15 JOOS
I need the answer to #10 based on the information from #9 in my Productions/Operations Management class. 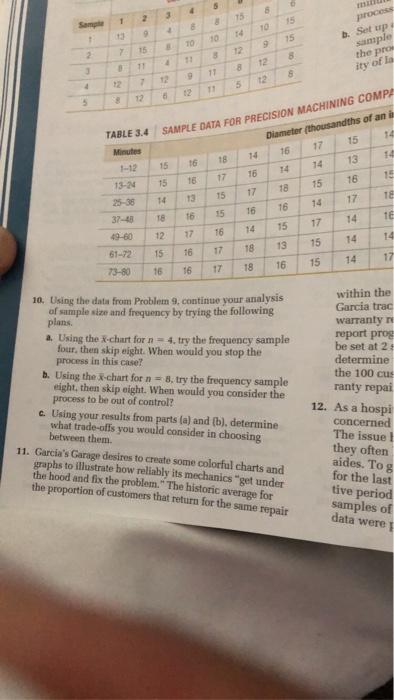
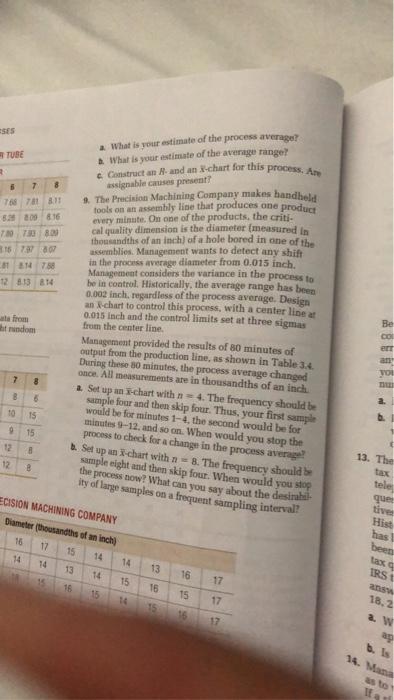
5 . 8 1 2 3 15 JOOS Sam + TO 9 14 10 15 TO 9 15 b. Set up sample the pro 2 13 11 12 17 8 ity of Lo 12 5 12 79 3 3 12 TABLE 3.4 Minutes SAMPLE DATA FOR PRECISION MACHINING COMPA Diameter (thousandths of an 18 14 16 17 15 14 14 14 13 15 16 15 17 1 16 15 13-24 16 15 18 17 15 14 TE 17 14 13 16 16 16 TB 15 18 14 m 17 37-43 49-60 15 14 12 17 16 14 14 15 13 15 16 18 17 61-72 73-80 17 15 14 16 16 16 18 17 10. Using the data from Problem 9, continuo your analysis of sample size and frequency by trying the following plans a. Using the X-chart for n = 4, try the frequency sample four, then skip eight. When would you stop the process in this case? 1. Using the x-chart for n = 8. try the frequency sample eight, then skip eight. When would you consider the process to be out of control? c. Using your results from parts (a) and (b), determine what trade-offs you would consider in choosing between them. within the Garcia trac warranty report prog be set at 2 determine the 100 cus ranty repai 12. As a hospi concerned The issue ! they often 11. Garcia's Garage desires to create some colorful charts and graphs to illustrate how reliably its mechanics "get under the hood and fix the problem." The historic average for the proportion of customers that return for the same repair aides. Tog for the last tive period samples of data were SES TUBE 6 7 8 7678181 5.84800816 70 70 What is your estimate of the process average? What is your estimate of the average range Construct and and an X-chart for this process. An assignable causes present? 1. The Precision Machining Company makes handheld tools on an assembly line that produces one product every minute. On one of the products, the criti cal quality dimension is the diameter (measured in thousandths of an inch) of a hole bored in one of the assemblies. Management wants to detect any shift in the process average diameter from 0.015 inch. Management considers the variance in the process to be in control. Historically, the average range has been 0.002 inch. regardless of the process average Design an I-chart to control this process, with a center linea 0.015 inch and the control limits set at three sigmas from the center line. 115777 1170 128.13 814 andom Be col er an VOL 7 8 8 19 15 Management provided the results of 80 minutes of output from the production line, as shown in Table 3.4 During these 30 minutes, the process average changed once. All measurements are in thousandths of an inch 2. Set up an 3-chart with n=4. The frequency should be sample four and then skip four. Thus, your first sample would be for minutes 1-4, the second would be for minutes 9-12. and so on. When would you stop the process to check for a change in the process average! Set up an i-clart with n = 8. The frequency should be sample eight and then skip four. When would you stop the process now? What can you say about the desirabil ity of large samples on a frequent sampling interval? 15 9 12 12 8 8 13. The tax tele que tive ECISION MACHINING COMPANY Diameter (thousandths of an inch) 17 15 14 14 14 13 14 15 16 15 Hist has been 16 14 13 16 IRS 15 17 16 15 14 17 15 15 17 ans 18,2 2. W ag b. 14. Mana as to LE 5 . 8 1 2 3 15 JOOS Sam + TO 9 14 10 15 TO 9 15 b. Set up sample the pro 2 13 11 12 17 8 ity of Lo 12 5 12 79 3 3 12 TABLE 3.4 Minutes SAMPLE DATA FOR PRECISION MACHINING COMPA Diameter (thousandths of an 18 14 16 17 15 14 14 14 13 15 16 15 17 1 16 15 13-24 16 15 18 17 15 14 TE 17 14 13 16 16 16 TB 15 18 14 m 17 37-43 49-60 15 14 12 17 16 14 14 15 13 15 16 18 17 61-72 73-80 17 15 14 16 16 16 18 17 10. Using the data from Problem 9, continuo your analysis of sample size and frequency by trying the following plans a. Using the X-chart for n = 4, try the frequency sample four, then skip eight. When would you stop the process in this case? 1. Using the x-chart for n = 8. try the frequency sample eight, then skip eight. When would you consider the process to be out of control? c. Using your results from parts (a) and (b), determine what trade-offs you would consider in choosing between them. within the Garcia trac warranty report prog be set at 2 determine the 100 cus ranty repai 12. As a hospi concerned The issue ! they often 11. Garcia's Garage desires to create some colorful charts and graphs to illustrate how reliably its mechanics "get under the hood and fix the problem." The historic average for the proportion of customers that return for the same repair aides. Tog for the last tive period samples of data were SES TUBE 6 7 8 7678181 5.84800816 70 70 What is your estimate of the process average? What is your estimate of the average range Construct and and an X-chart for this process. An assignable causes present? 1. The Precision Machining Company makes handheld tools on an assembly line that produces one product every minute. On one of the products, the criti cal quality dimension is the diameter (measured in thousandths of an inch) of a hole bored in one of the assemblies. Management wants to detect any shift in the process average diameter from 0.015 inch. Management considers the variance in the process to be in control. Historically, the average range has been 0.002 inch. regardless of the process average Design an I-chart to control this process, with a center linea 0.015 inch and the control limits set at three sigmas from the center line. 115777 1170 128.13 814 andom Be col er an VOL 7 8 8 19 15 Management provided the results of 80 minutes of output from the production line, as shown in Table 3.4 During these 30 minutes, the process average changed once. All measurements are in thousandths of an inch 2. Set up an 3-chart with n=4. The frequency should be sample four and then skip four. Thus, your first sample would be for minutes 1-4, the second would be for minutes 9-12. and so on. When would you stop the process to check for a change in the process average! Set up an i-clart with n = 8. The frequency should be sample eight and then skip four. When would you stop the process now? What can you say about the desirabil ity of large samples on a frequent sampling interval? 15 9 12 12 8 8 13. The tax tele que tive ECISION MACHINING COMPANY Diameter (thousandths of an inch) 17 15 14 14 14 13 14 15 16 15 Hist has been 16 14 13 16 IRS 15 17 16 15 14 17 15 15 17 ans 18,2 2. W ag b. 14. Mana as to LE
Step by Step Solution
There are 3 Steps involved in it
1 Expert Approved Answer
Step: 1 Unlock

Question Has Been Solved by an Expert!
Get step-by-step solutions from verified subject matter experts
Step: 2 Unlock
Step: 3 Unlock