

Question: b/Compute the lower control limit (LCL) for X chart. (Round to 1 decimal place) c/Compute the upper control limit (UCL) for M R chart. (Round
b/Compute the lower control limit (LCL) for X chart. (Round to 1 decimal place)
c/Compute the upper control limit (UCL) for M R chart. (Round to 2 decimal places)
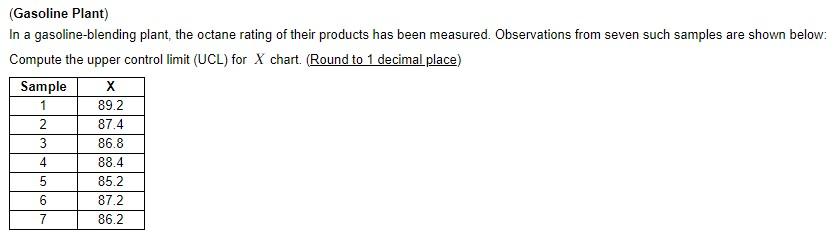
In a gasoline-blending plant, the octane rating of their products has been measured. Observations from seven such samples are shown below: Compute the upper control limit (UCL) for X chart. (Round to 1 decimal place)
Step by Step Solution
There are 3 Steps involved in it
1 Expert Approved Answer
Step: 1 Unlock

Question Has Been Solved by an Expert!
Get step-by-step solutions from verified subject matter experts
Step: 2 Unlock
Step: 3 Unlock