

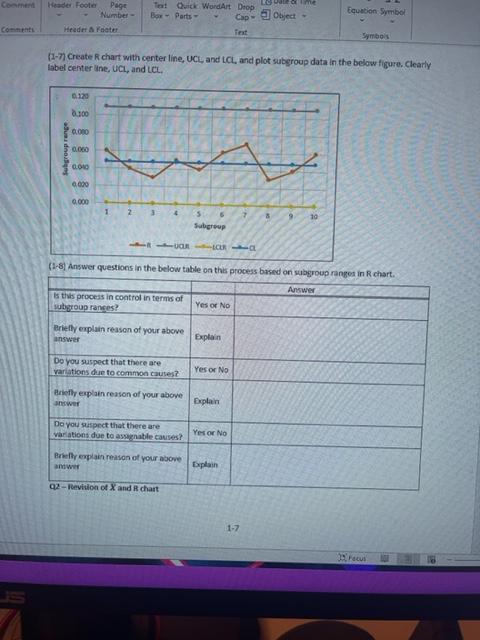
Question: answer question 1-8 F1-7) Create R chart with center line, UCL and LCL, and plot saberoup data in the below figure. Clearly label center une,
answer question 1-8
F1-7) Create R chart with center line, UCL and LCL, and plot saberoup data in the below figure. Clearly label center une, UCL, and tel. (2-8) Answer oqestions in the below table on this process based on subgrous rangen in R chartStep by Step Solution
There are 3 Steps involved in it
1 Expert Approved Answer
Step: 1 Unlock

Question Has Been Solved by an Expert!
Get step-by-step solutions from verified subject matter experts
Step: 2 Unlock
Step: 3 Unlock