

Question: (2-5) Create X chart with center line, UCL, and LCL, and plot subgroup data in the below figure (do not plot data for subgroup 6
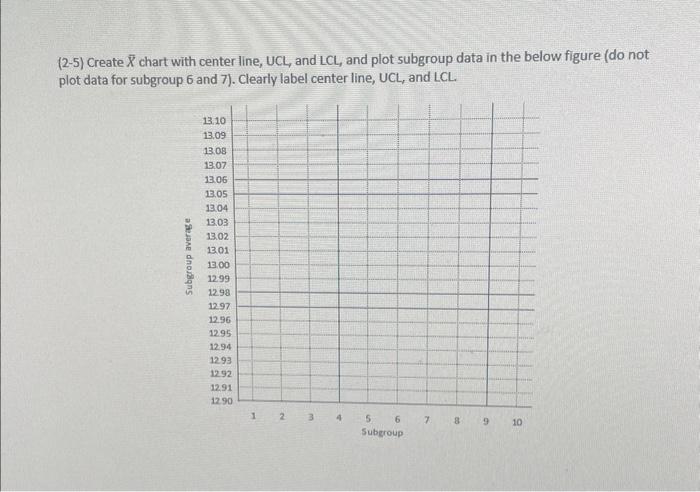
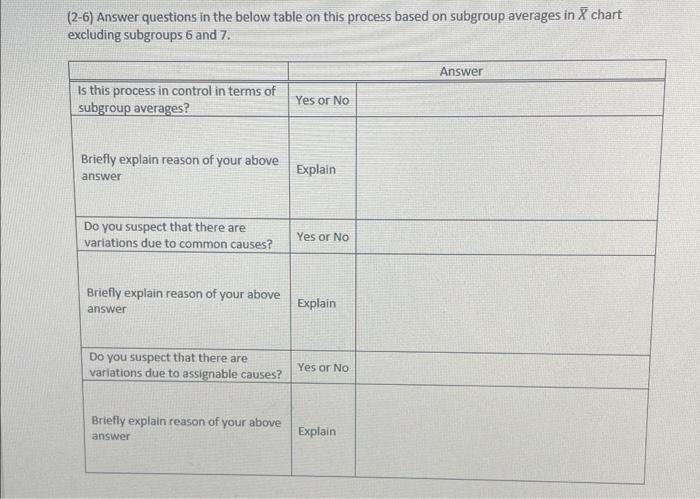
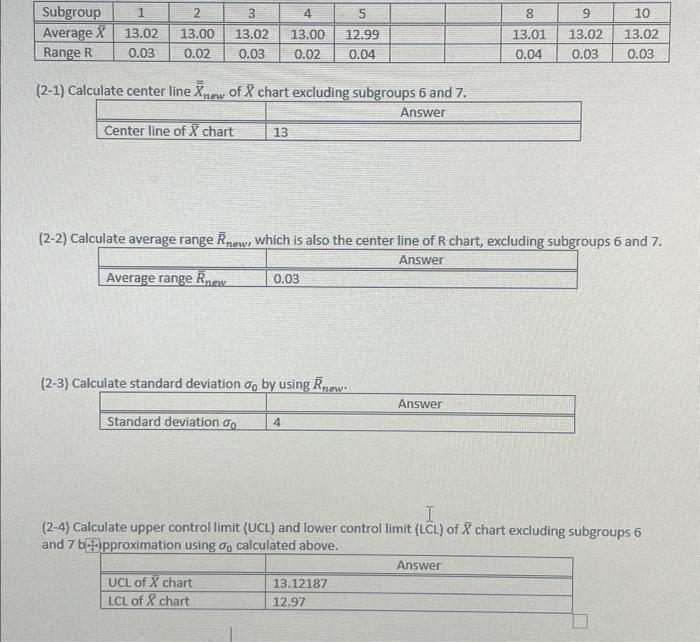
(2-5) Create X chart with center line, UCL, and LCL, and plot subgroup data in the below figure (do not plot data for subgroup 6 and 7). Clearly label center line, UCL, and LCL. (2-6) Answer questions in the below table on this process based on subgroup averages in X chart excluding subgroups 6 and 7 . (2-1) Calculate center line X..... of X chart excluding suharouns f and 7. (2-2) Calculate average range Rnew, which is also the center line of R chart. excluding subgroups 6 an (2-3) Calculate standard deviation n hu usin R (2-4) Calculate upper control limit (UCL) and lower control limit (LCL) of X chart excluding subgroups 6 and 7 b fipproximation using n calculated above
Step by Step Solution
There are 3 Steps involved in it

Get step-by-step solutions from verified subject matter experts