

Question: Answer question 4 Mean 76.5318 Median 76.255 Scores Before Standard Tutoring 8.998812519 Deviation Range 42.59 Mean 78.709 + Median 79.51 Scores After Standard Tutoring Deviation
Answer question 4
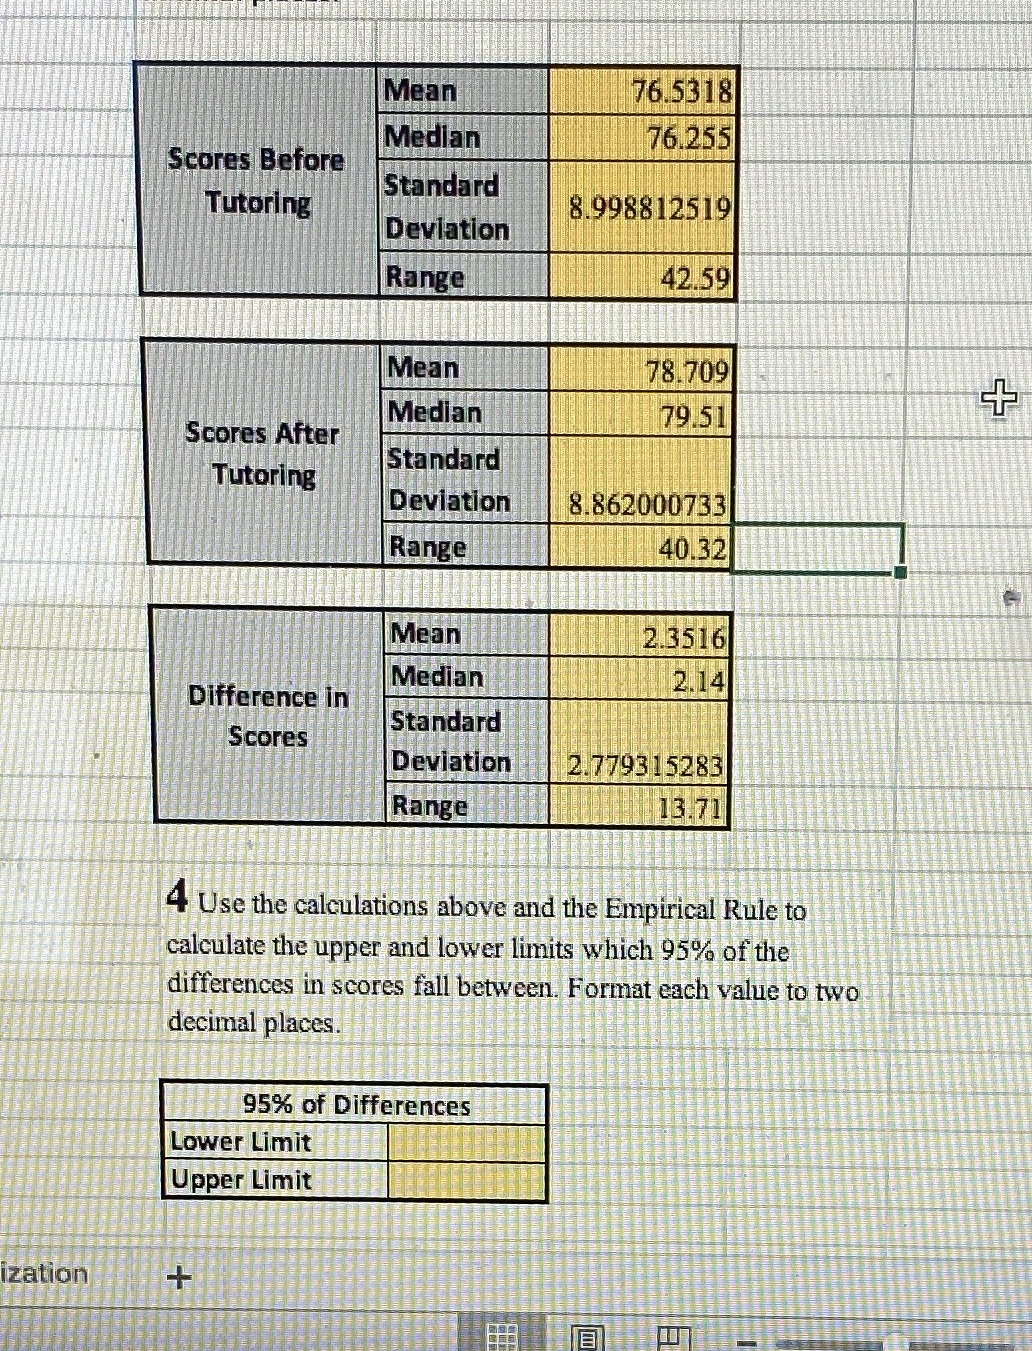
Mean 76.5318 Median 76.255 Scores Before Standard Tutoring 8.998812519 Deviation Range 42.59 Mean 78.709 + Median 79.51 Scores After Standard Tutoring Deviation 8.862000733 Range 40.32 Mean 2.3516 Median 2.14 Difference in Standard Scores Deviation 2.779315283 Range 13.71 4 Use the calculations above and the Empirical Rule to calculate the upper and lower limits which 95% of the differences in scores fall between. Format each value to two decimal places. 95% of Differences Lower Limit Upper Limit ization +
Step by Step Solution
There are 3 Steps involved in it
1 Expert Approved Answer
Step: 1 Unlock

Question Has Been Solved by an Expert!
Get step-by-step solutions from verified subject matter experts
Step: 2 Unlock
Step: 3 Unlock