

Question: Answer questions 5 , and 6 based on the case and data given in the following: The worker on the picture is performing quality control
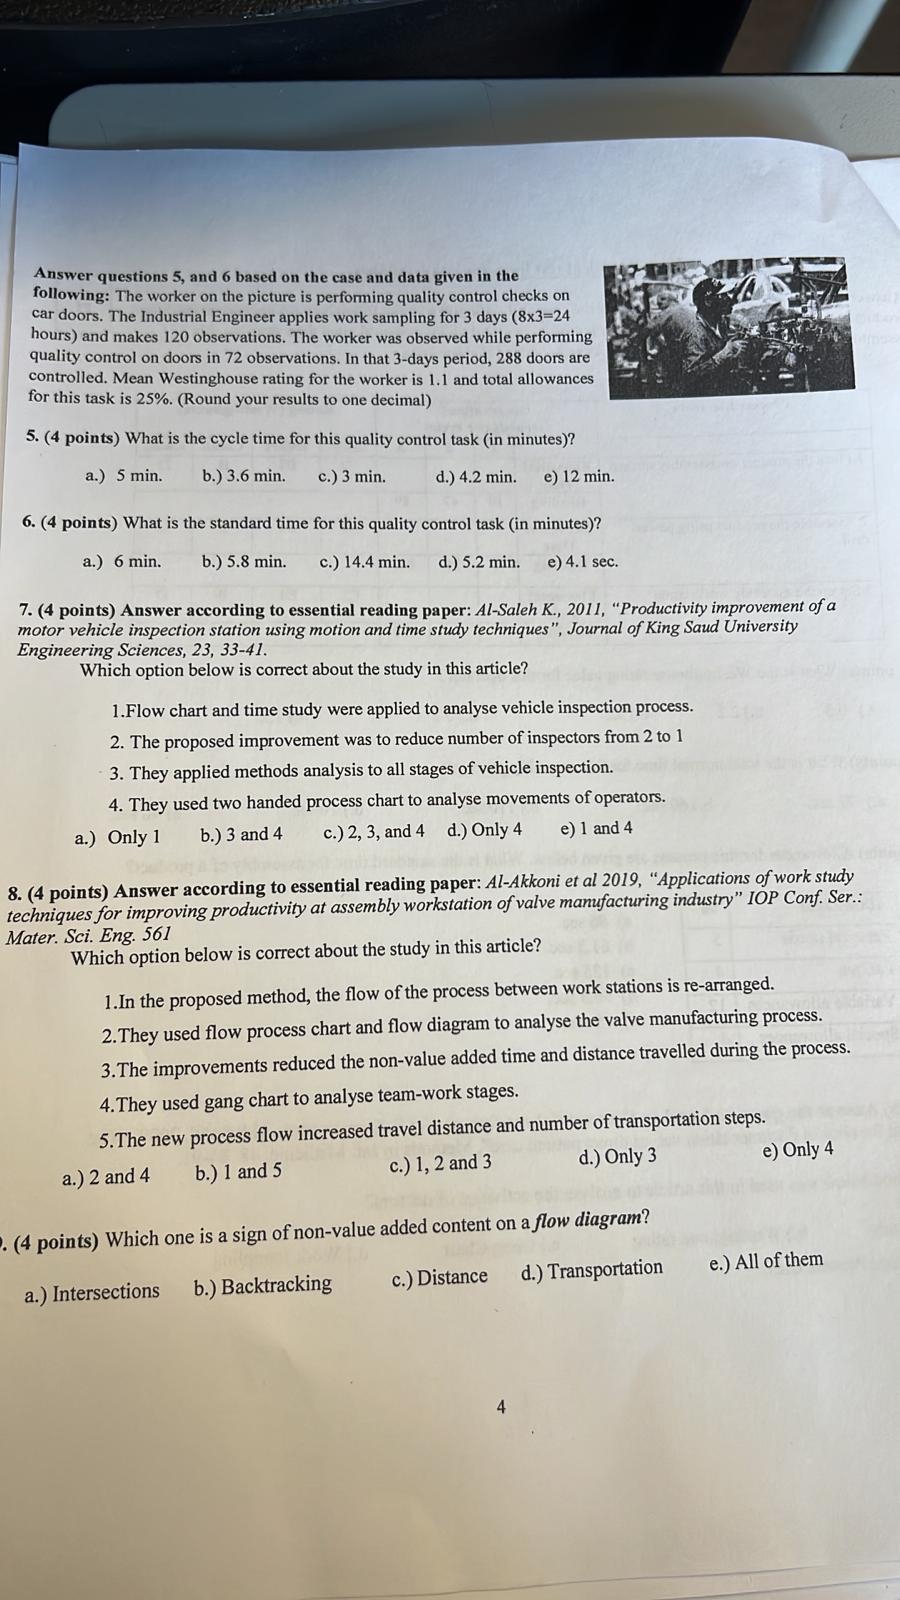
Answer questions and based on the case and data given in the following: The worker on the picture is performing quality control checks on car doors. The Industrial Engineer applies work sampling for days hours and makes observations. The worker was observed while performing quality control on doors in observations. In that days period, doors are controlled. Mean Westinghouse rating for the worker is and total allowances for this task is Round your results to one decimal
points What is the cycle time for this quality control task in minutes
amin.
bmin.
cmin.
dmin.
emin.
points What is the standard time for this quality control task in minutes
amin.
bmin.
cmin.
dmin.
e
points Answer according to essential reading paper: AlSaleh K "Productivity improvement of a motor vehicle inspection station using motion and time study techniques", Journal of King Saud University Engineering Sciences,
Which option below is correct about the study in this article?
Flow chart and time study were applied to analyse vehicle inspection process.
The proposed improvement was to reduce number of inspectors from to
They applied methods analysis to all stages of vehicle inspection.
They used two handed process chart to analyse movements of operators.
a Only
b and
c and
d Only
e and
points Answer according to essential reading paper: AlAkkoni et al "Applications of work study techniques for improving productivity at assembly workstation of valve mamufacturing industry" IOP Conf. Ser.: Mater. Sci. Eng.
Which option below is correct about the study in this article?
In the proposed method, the flow of the process between work stations is rearranged.
They used flow process chart and flow diagram to analyse the valve manufacturing process.
The improvements reduced the nonvalue added time and distance travelled during the process.
They used gang chart to analyse teamwork stages.
The new process flow increased travel distance and number of transportation steps.
a and
b and
c and
d Only
e Only
points Which one is a sign of nonvalue added content on a flow diagram?
a Intersections
b Backtracking
c Distance
d Transportation
e All of them
Step by Step Solution
There are 3 Steps involved in it
1 Expert Approved Answer
Step: 1 Unlock

Question Has Been Solved by an Expert!
Get step-by-step solutions from verified subject matter experts
Step: 2 Unlock
Step: 3 Unlock