

Question: Answer questions in picture An advertising firm wishes to demonstrate to its clients the effectiveness of the advertising campaigns it has conducted. The following bivariate
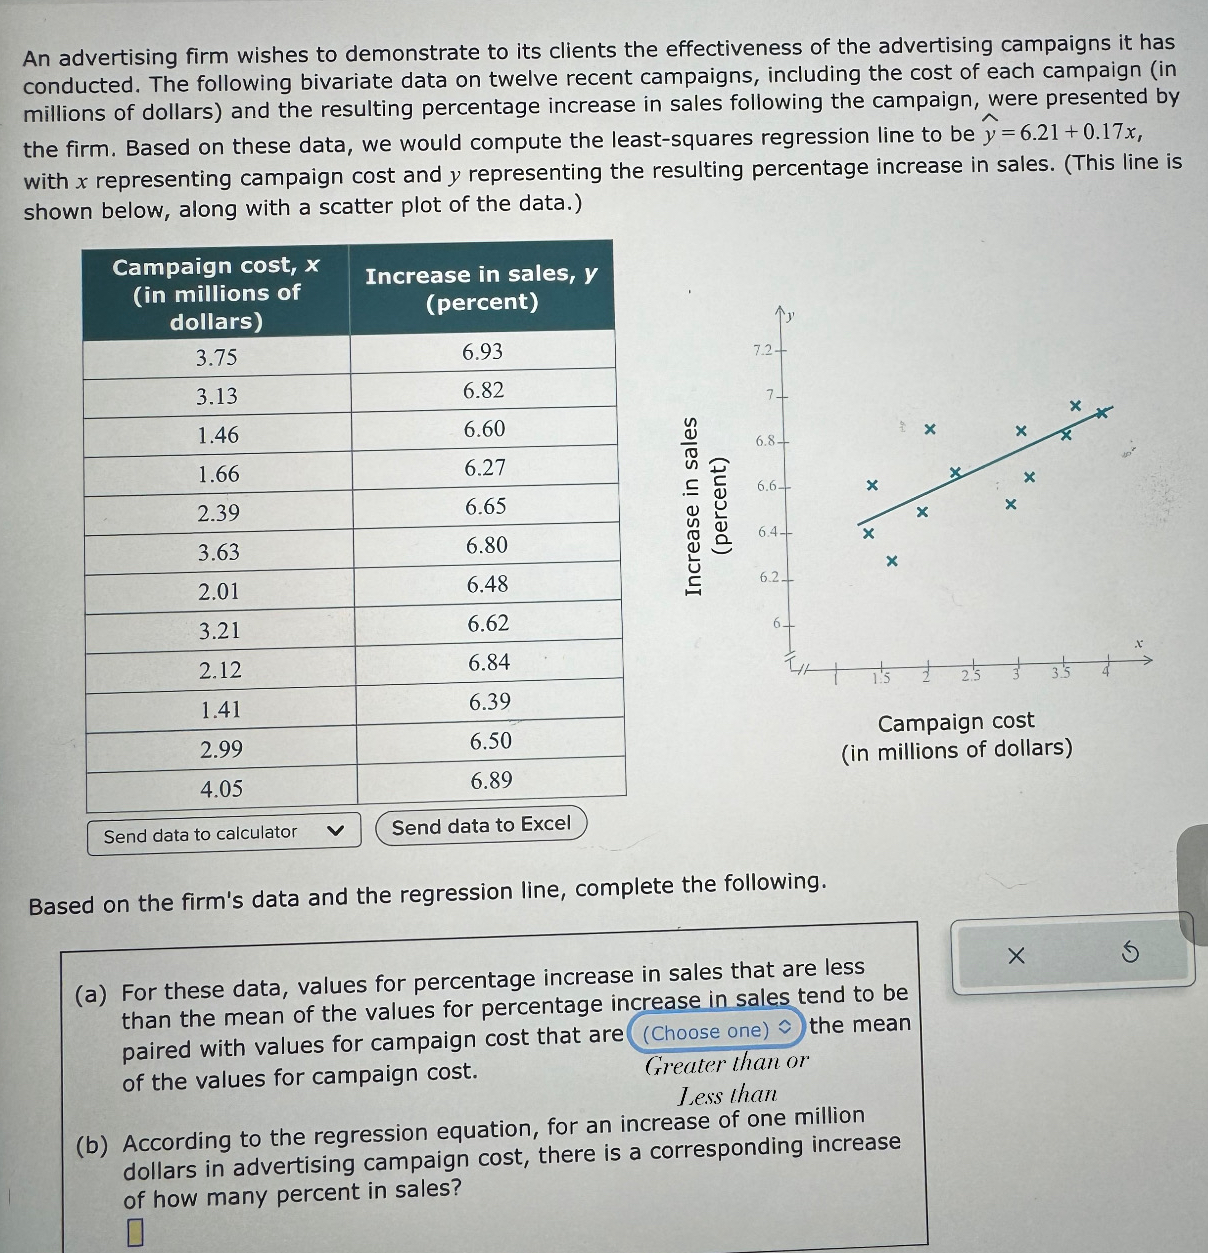
An advertising firm wishes to demonstrate to its clients the effectiveness of the advertising campaigns it has conducted. The following bivariate data on twelve recent campaigns, including the cost of each campaign (in millions of dollars) and the resulting percentage increase in sales following the campaign, were presented by the firm. Based on these data, we would compute the least-squares regression line to be y =6.21 + 0.17 x, with x representing campaign cost and y representing the resulting percentage increase in sales. (This line is shown below, along with a scatter plot of the data.) Campaign cost, x Increase in sales, y (in millions of dollars) 3.75 3.13 1.46 I .66 2.39 3.63 2.01 3.21 2.12 1.41 2.99 4.05 (percent) 6.93 6.82 6.60 6.27 6.65 6.80 6.48 6.62 6.84 6.39 6.50 6.89 u 6.8 6.6 6.4 62 x x x 35 Campaign cost (in millions of dollars) Send data to calculator v Send data to Excel Based on the firm's data and the regression line, complete the following. (a) For these data, values for percentage increase in sales that are less tend to be than the mean of the values for percentage inc the mean paired with values for campaign cost that are (Choose one) c Greater than or of the values for campaign cost. Less [han (b) According to the regression equation, for an increase of one million dollars in advertising campaign cost, there is a corresponding increase of how many percent in sales?
Step by Step Solution
There are 3 Steps involved in it

Get step-by-step solutions from verified subject matter experts