

Question: The scatter plot shows the time spent texting and the time spent exercising by each of 25 students last week. Also shown is the line
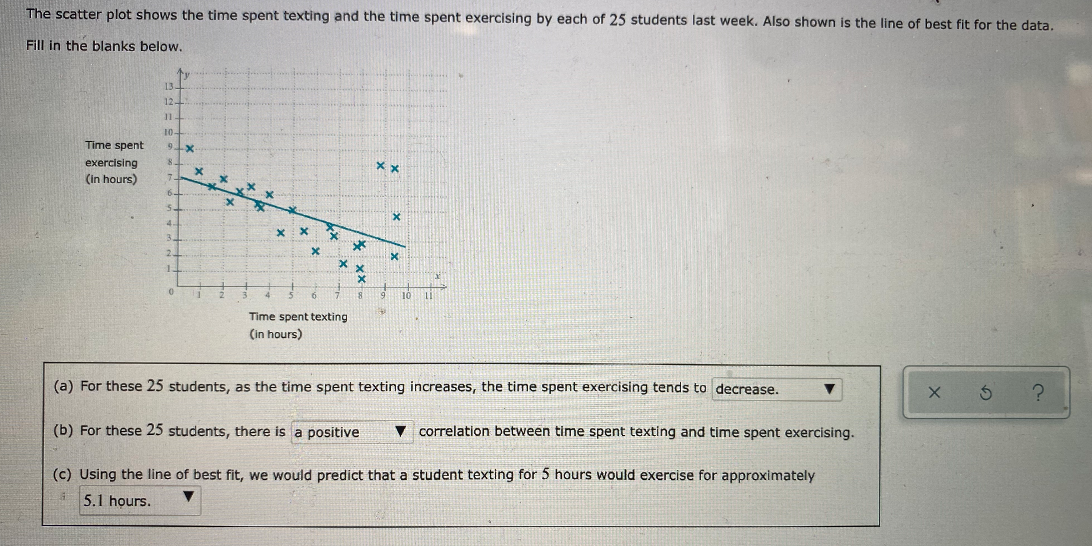
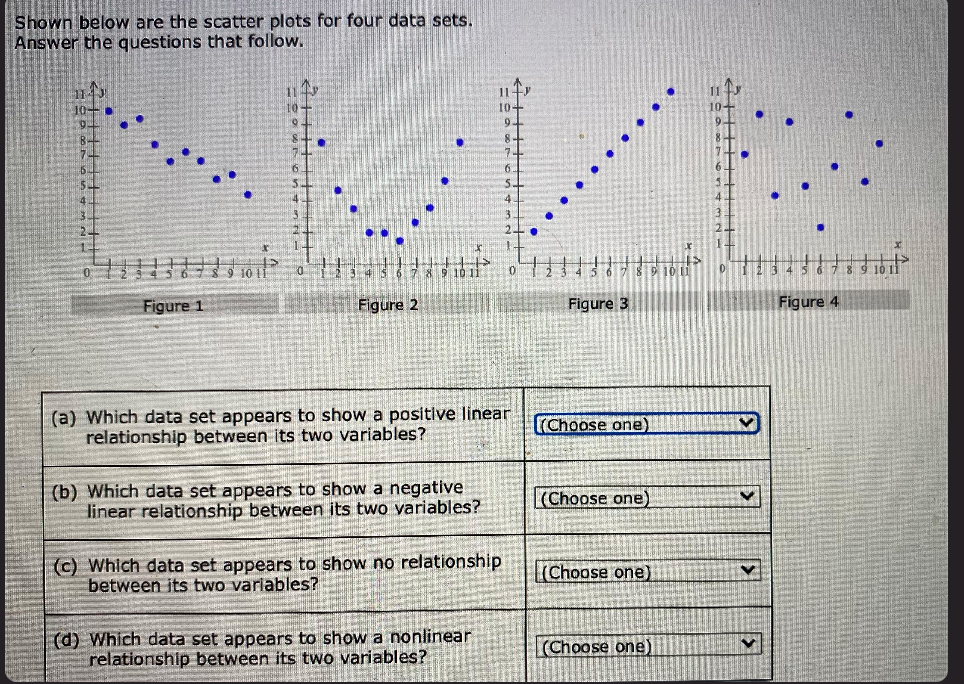
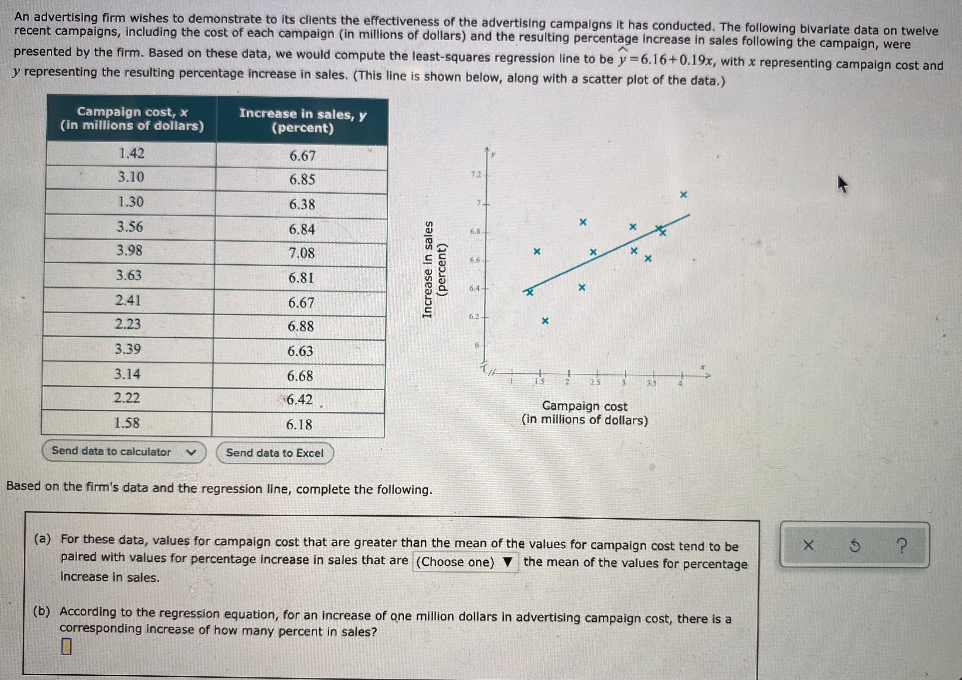
The scatter plot shows the time spent texting and the time spent exercising by each of 25 students last week. Also shown is the line of best fit for the data. Fill in the blanks below. 12- Time spent exercising X X (in hours) X X X X X 10 Time spent texting (in hours) (a) For these 25 students, as the time spent texting increases, the time spent exercising tends to decrease. X 5 ? (b) For these 25 students, there is a positive correlation between time spent texting and time spent exercising. (c) Using the line of best fit, we would predict that a student texting for 5 hours would exercise for approximately 5.1 hours.Shown below are the scatter plots for four data sets. Answer the questions that follow. 10- 10- . . 10- 0 12 3 4 3 6 7 8 9 10 1 Figure 1 Figure 2 Figure 3 Figure 4 (a) Which data set appears to show a positive linear relationship between its two variables? (Choose one) (b) Which data set appears to show a negative linear relationship between its two variables? (Choose one) (c) Which data set appears to show no relationship between its two variables? (Choose one) (d) Which data set appears to show a nonlinear relationship between its two variables? (Choose one)An advertising firm wishes to demonstrate to its clients the effectiveness of the advertising campaigns it has conducted. The following bivariate data on twelve recent campaigns, including the cost of each campaign (in millions of dollars) and the resulting percentage increase in sales following the campaign, were presented by the firm. Based on these data, we would compute the least-squares regression line to be y =6.16+0.19x, with x representing campaign cost and y representing the resulting percentage increase in sales. (This line is shown below, along with a scatter plot of the data.) Campaign cost, x Increase in sales, y (in millions of dollars) (percent) 1.42 6.67 3.10 6.85 72 1.30 6.38 3.56 6.84 6.8 3.98 7.08 6.6 (percent) Increase in sales 3.63 6.81 2.41 6.67 6.2 2.23 6.88 3.39 6.63 3.14 6.68 25 2.22 6.42 Campaign cost 1.58 6.18 (in millions of dollars) Send data to calculator Send data to Excel Based on the firm's data and the regression line, complete the following. (a) For these data, values for campaign cost that are greater than the mean of the values for campaign cost tend to be X 5 ? paired with values for percentage increase in sales that are (Choose one) V the mean of the values for percentage increase in sales. (b) According to the regression equation, for an increase of one million dollars in advertising campaign cost, there is a corresponding increase of how many percent in sales
Step by Step Solution
There are 3 Steps involved in it

Get step-by-step solutions from verified subject matter experts