

Question: Answer the below questions (5) based on the tables (statistics) provided below, preferably in paragraphs. What is the R 2 value from this analysis? What
Answer the below questions (5) based on the tables (statistics) provided below, preferably in paragraphs.
- What is the R2 value from this analysis? What does it mean?
- What is the equation for predicting income from years of education?
- Using this model, ifWilliamhas16yearsofeducation,whatwouldbethe approximateexpectedyearlysalary?
4. IfJohnhas12yearsofeducation,what approximatesalarywouldheexpect onaverage?
5. Describe why, and using your analytical results, "correlation does not imply causation." What does the phrase mean as it relates to this data? What other factors may need to be considered when evaluating the meaning of this relationship, and whether it can be applied universally to all environmental technicians across the U.S.? What are some limitations that should be identified when using these results?
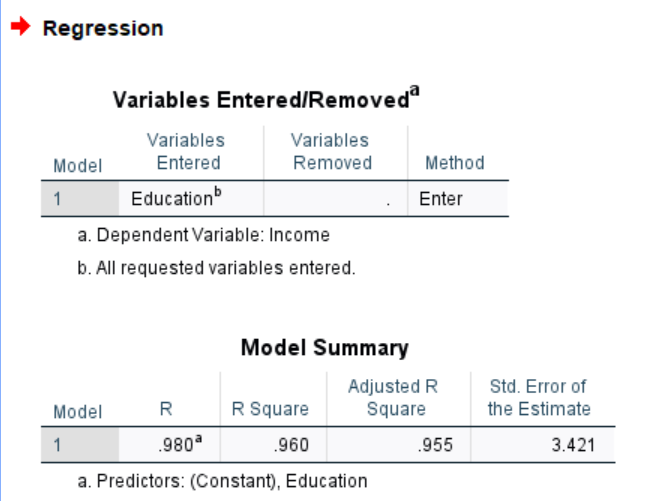
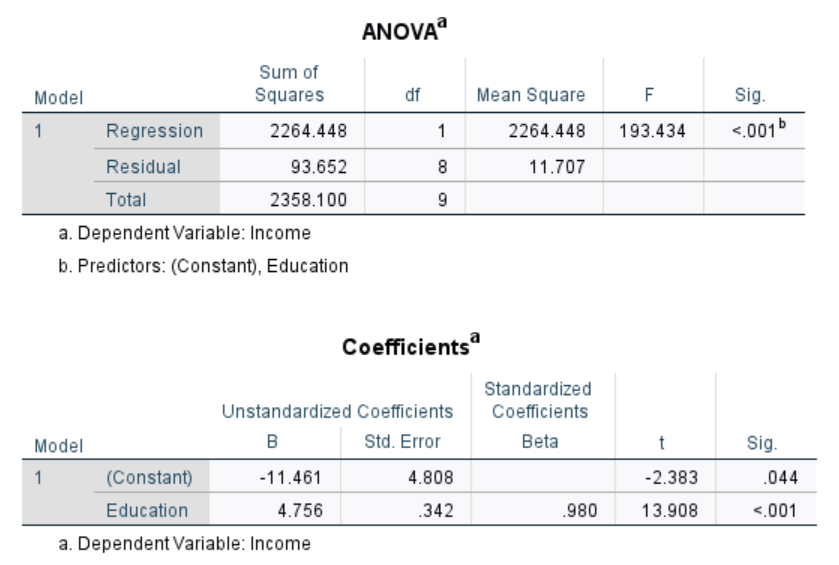
= Regression Variables Entered/Removed Variables Variables Model Entered Removed Method 1 Education . Enter a. Dependent Variable: Income b. All requested variables entered. Model Summary Adjusted R Std. Error of Model R R Square Square the Estimate 1 .980 960 g5 3.421 a. Predictors: (Constant), Education ANOVA Sum of Model Squares df Mean Square F Sig Regression 2264.448 1 2264.448 193.434 <.001b residual total a. dependent variable: income b. predictors: education coefficients standardized unstandardized model b std. error beta sig. .044 .342>
Step by Step Solution
There are 3 Steps involved in it

Get step-by-step solutions from verified subject matter experts