

Question: Answer the following question Question 22 S pts A professor teaches a large introductory statistics class. Here is a dotplot of the scores for the
Answer the following question
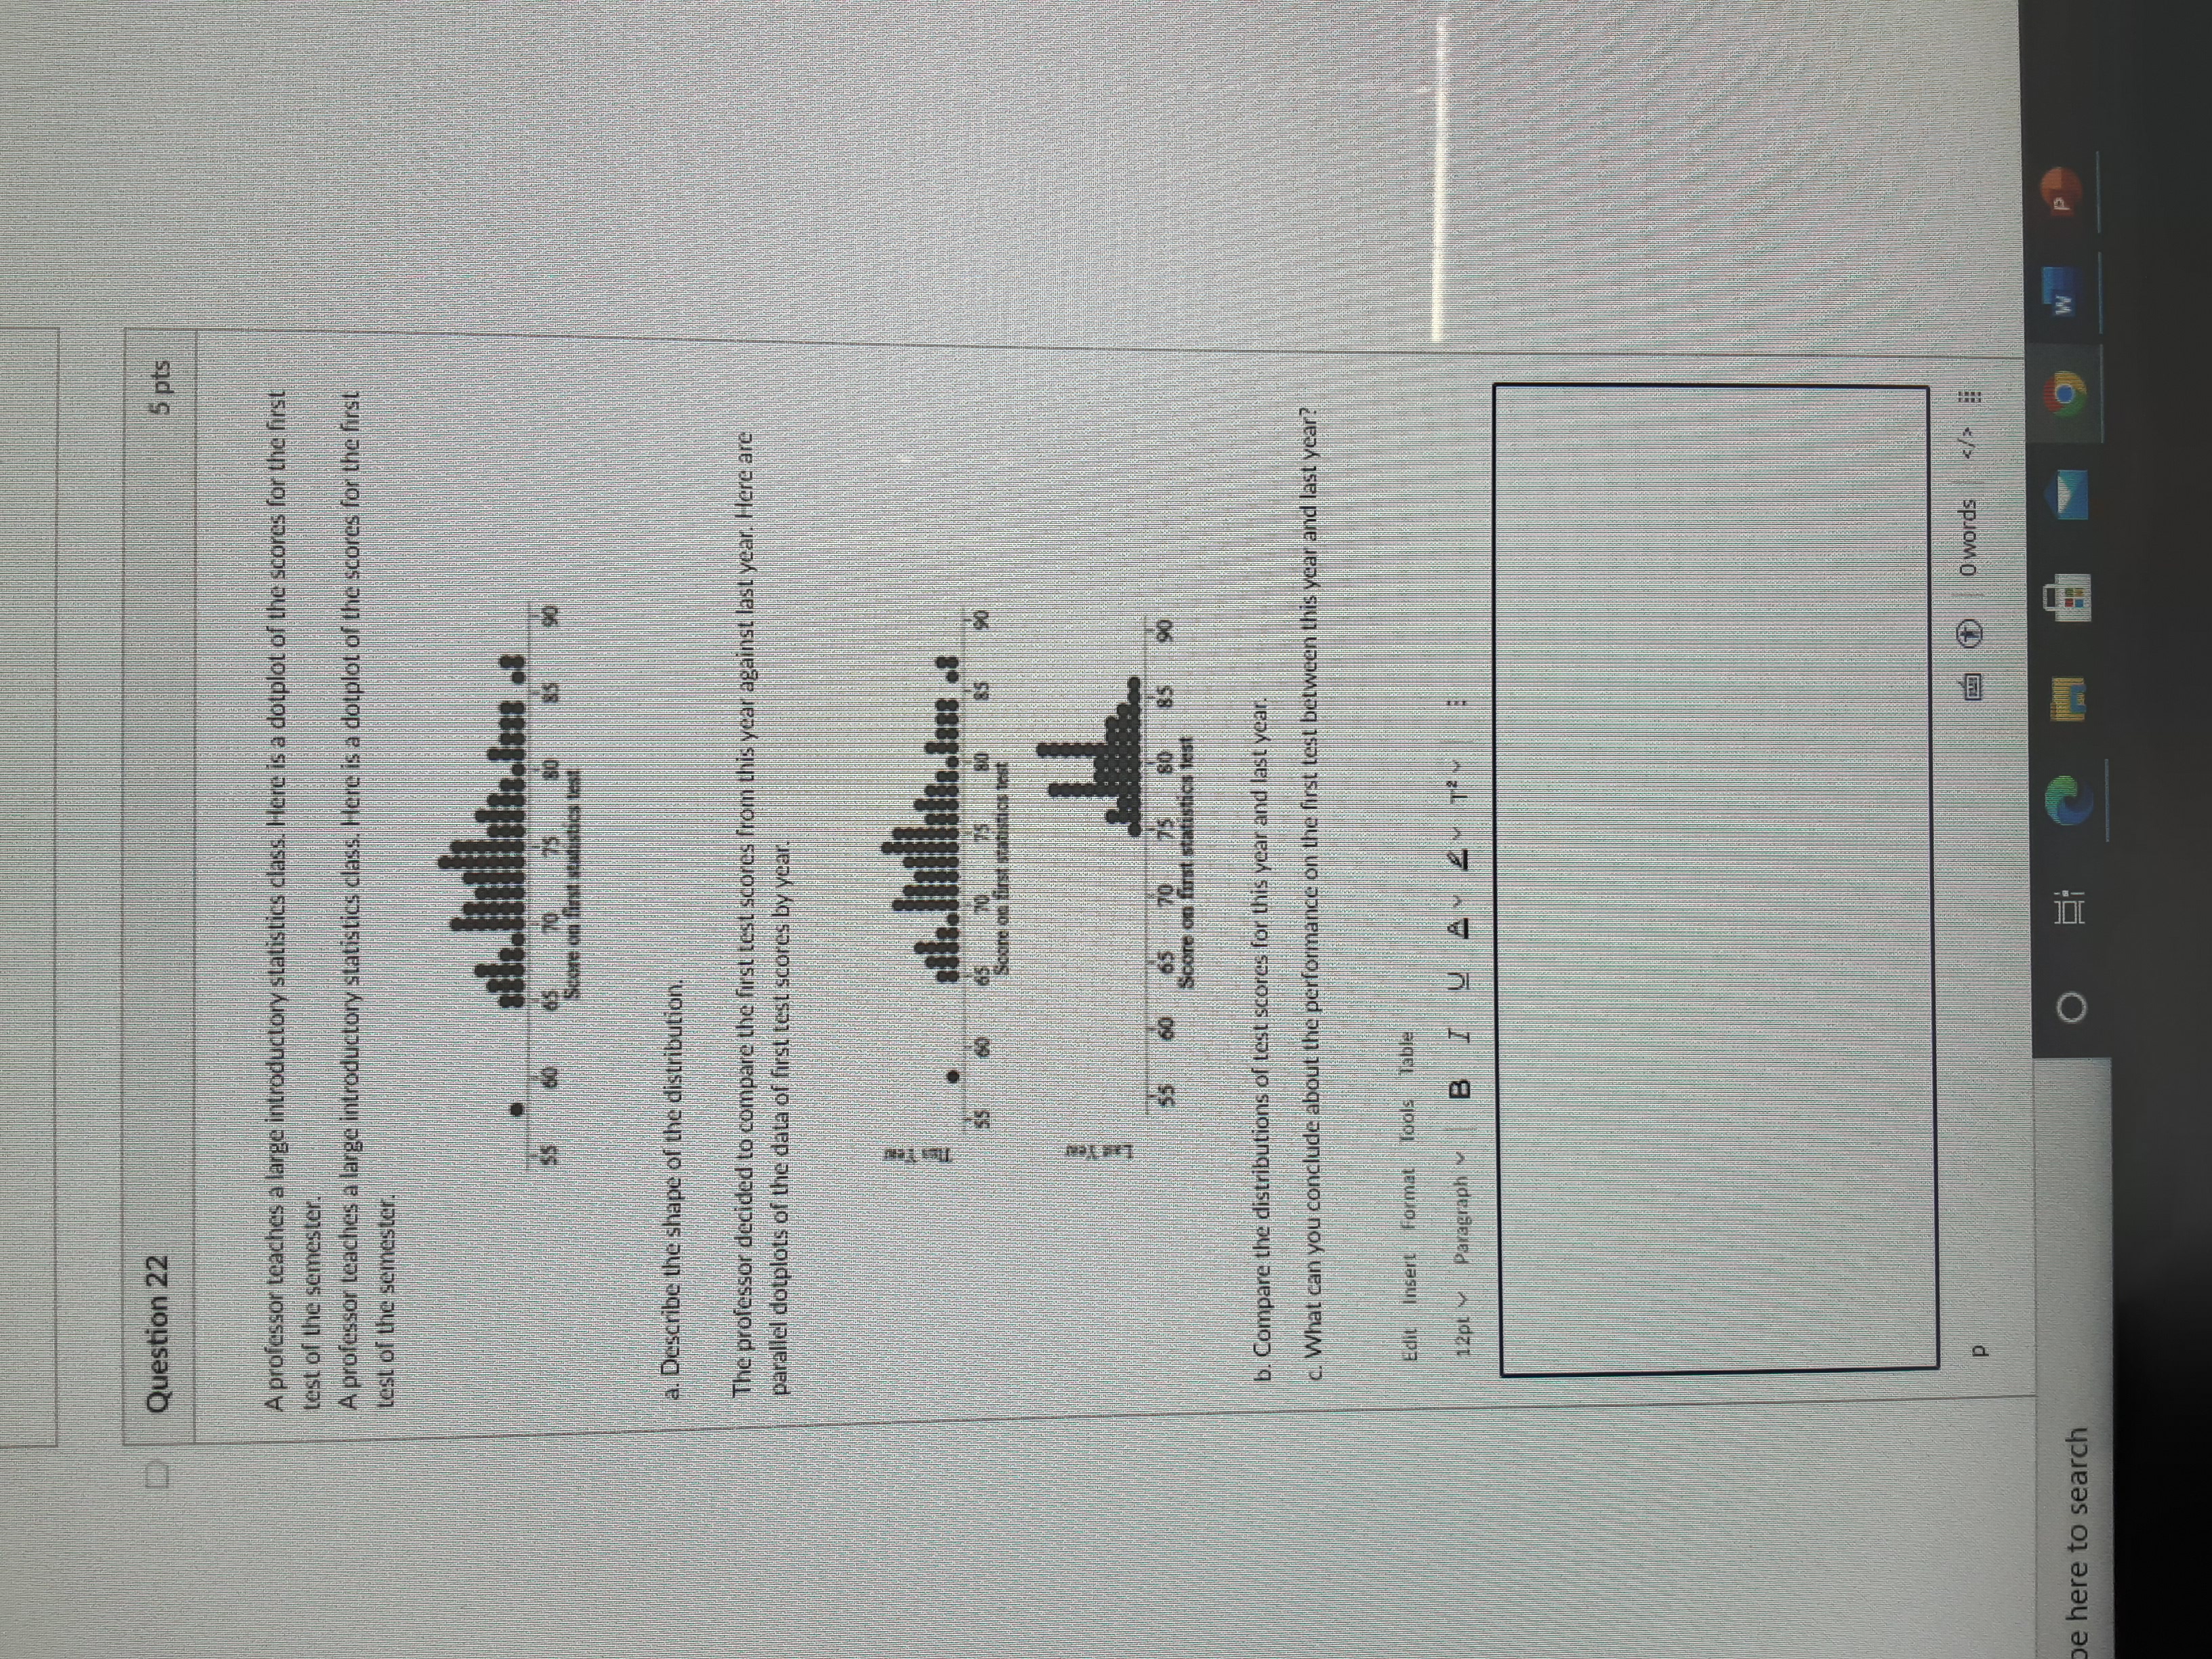
Question 22 S pts A professor teaches a large introductory statistics class. Here is a dotplot of the scores for the first test of the semester. A professor teaches a large introductory statistics class. Here is a dotplot of the scores for the first test of the semester. Score on fin cabbages beat a. Describe the shape of the distribution. The professor decided to compare the first test scores from this year against last year. Here are parallel dotplots of the data of first test scores by year. istion test Lad Year 55 60 65 70 score on first statistics test b. Compare the distributions of test scores for this year and last year! c. What can you conclude about the performance on the first test between this year and last year? edit insert Format Tools Table 1 2pt Paragraph B I JA O words be here to search O Eli W P
Step by Step Solution
There are 3 Steps involved in it

Get step-by-step solutions from verified subject matter experts