

Question: answer the missing cells make senarios to show which senario we can make profit and find the break even begin{tabular}{|c|c|c|c|c|c|c|c|c|c|} hline Scenario & Description &
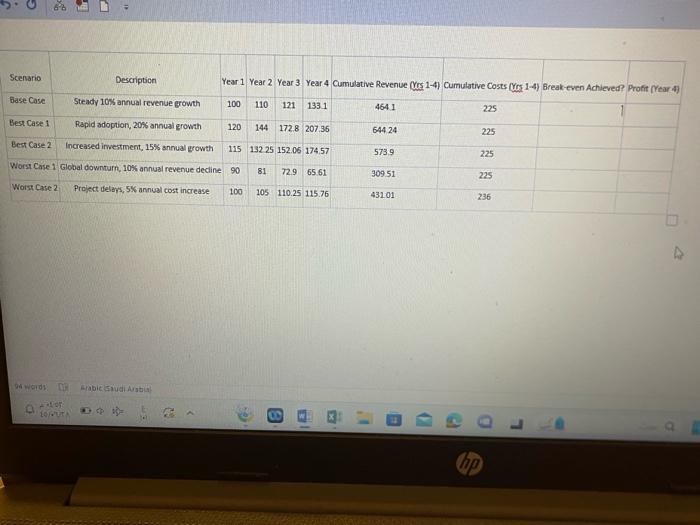
\begin{tabular}{|c|c|c|c|c|c|c|c|c|c|} \hline Scenario & Description & Year 1 & Year 2 & Year 3 & Year 4 & Cumulative Revenue (Ves 1-4) & 1) Cumulative Costs (Yos 1-4) & 1) Break-even Achieved? & Profit (Year 4) \\ \hline Base Cose & Steady 10% anoual revenue growth & 100 & 110 & 121 & 133.1 & 4641 & 225 & & 1 \\ \hline Best Case 1 & Rapid adoption, 20% annual growth & 120 & 144 & 172.8 & 207.36 & 644.24 & 225 & & \\ \hline Best Case 2 & Increased investment, 15% snnual growth & 115 & 13225 & 152.06 & 174,57 & 573.9 & 225 & & \\ \hline Worst Cise 1 & Global downtum, 10\% annual revenue decline & e 90 & 81 & 72.9 & 65.61 & 30951 & 225 & & \\ \hline Worst Case 2 & Project delars, 5K annual cost increase & 100 & 105 & 110.25 & 115.76 & 43101 & 236 & & \\ \hline \end{tabular}
Step by Step Solution
There are 3 Steps involved in it

Get step-by-step solutions from verified subject matter experts