

Question: answer the questions using the chart above begin{tabular}{ccccc} hline & & multicolumn{3}{c}{ Time Estimates (in weeks) } cline { 3 - 5 } Activity
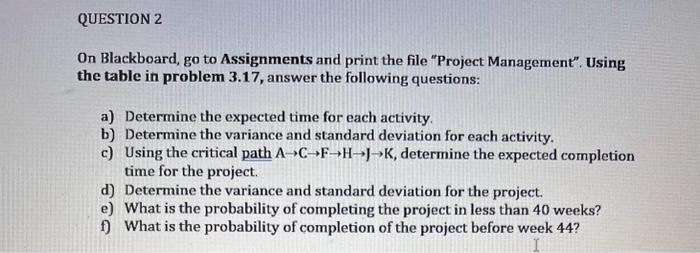
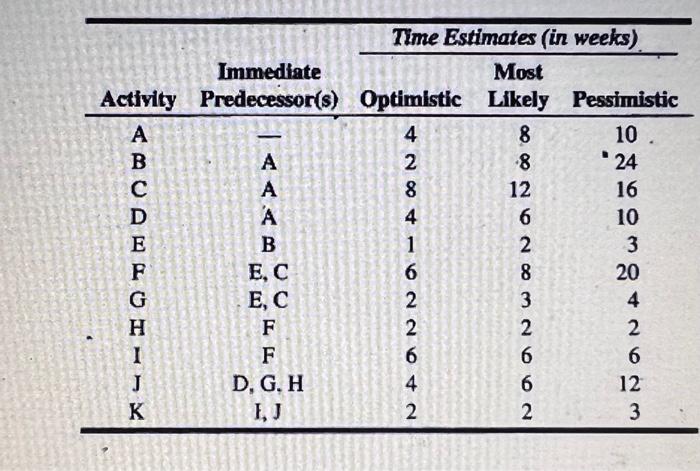
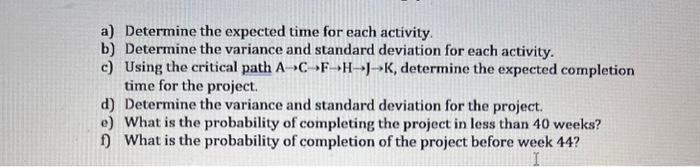
\begin{tabular}{ccccc} \hline & & \multicolumn{3}{c}{ Time Estimates (in weeks) } \\ \cline { 3 - 5 } Activity & ImmediatePredecessor(s) & MostOptimistic & LikelyPessimistic \\ \hline A & - & 4 & 8 & 10 \\ B & A & 2 & 8 & 24 \\ C & A & 8 & 12 & 16 \\ D & A & 4 & 6 & 10 \\ E & B & 1 & 2 & 3 \\ F & E, C & 6 & 8 & 20 \\ G & E, C & 2 & 3 & 4 \\ H & F & 2 & 2 & 2 \\ I & F & 6 & 6 & 6 \\ J & D, G, H & 4 & 6 & 12 \\ K & I, J & 2 & 2 & 3 \\ \hline \end{tabular} a) Determine the expected time for each activity. b) Determine the variance and standard deviation for each activity. c) Using the critical path ACFHJK, determine the expected completion time for the project. d) Determine the variance and standard deviation for the project. e) What is the probability of completing the project in less than 40 weeks? f) What is the probability of completion of the project before week 44 ? On Blackboard, go to Assignments and print the file "Project Management". Using the table in problem 3.17, answer the following questions: a) Determine the expected time for each activity. b) Determine the variance and standard deviation for each activity. c) Using the critical path ACFHJK, determine the expected completion time for the project. d) Determine the variance and standard deviation for the project. e) What is the probability of completing the project in less than 40 weeks? f) What is the probability of completion of the project before week 44
Step by Step Solution
There are 3 Steps involved in it

Get step-by-step solutions from verified subject matter experts