

Question: Answer these numericals Refer to the data on x = liberation rate and y = NO, emission rate given in Exercise 19. a. Does the
Answer these numericals
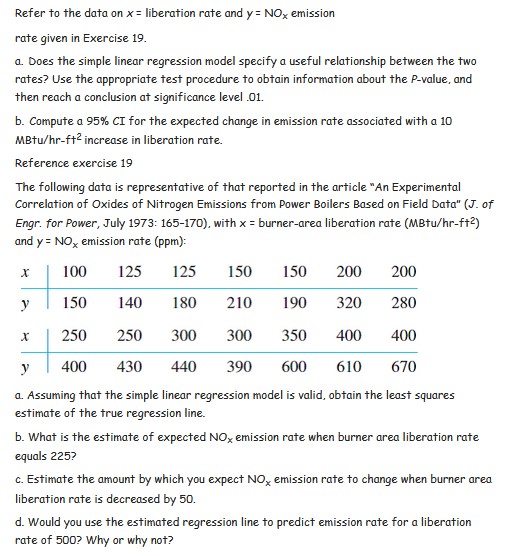
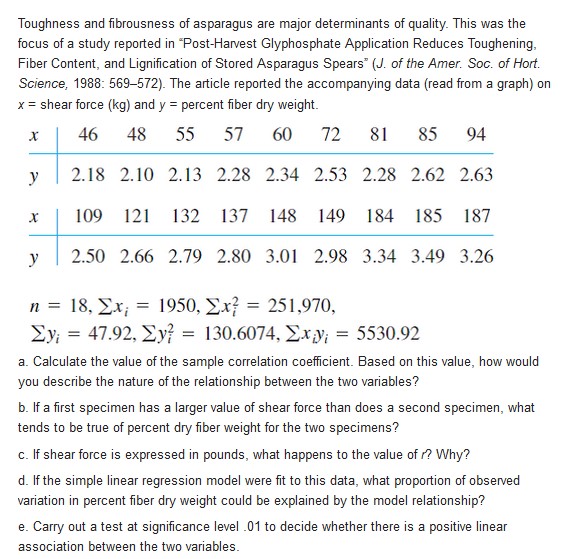

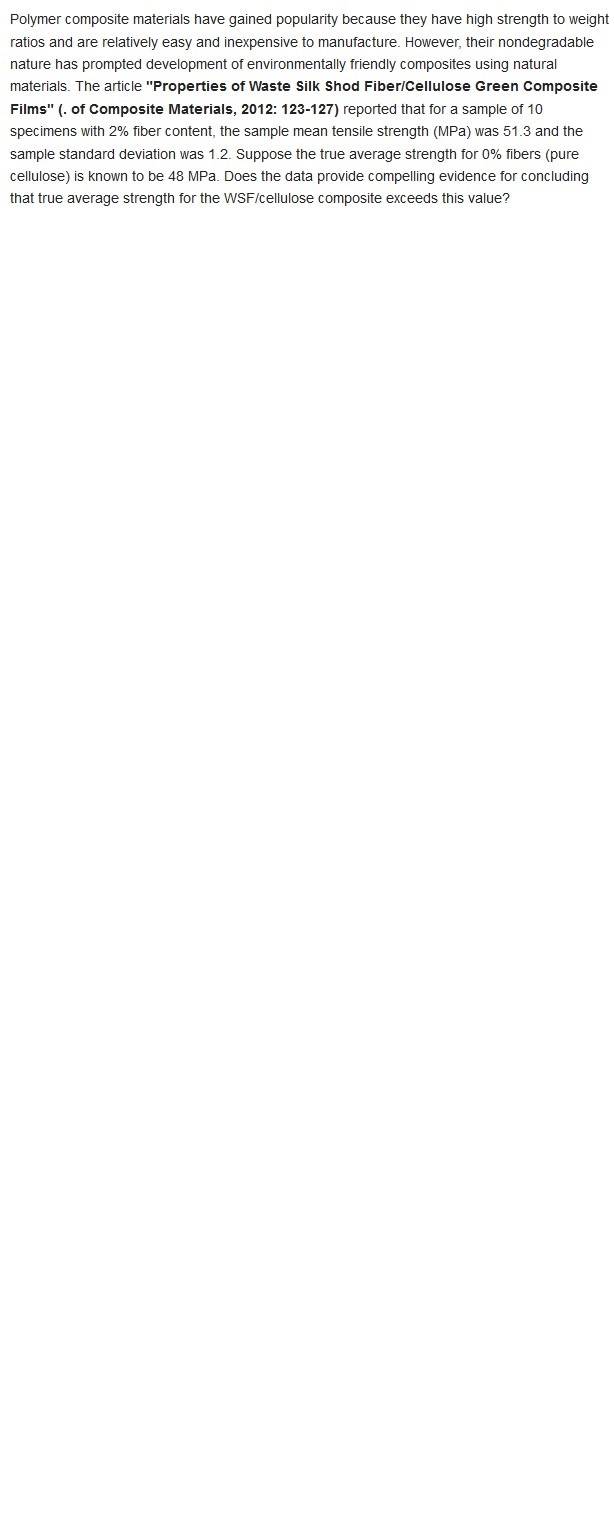
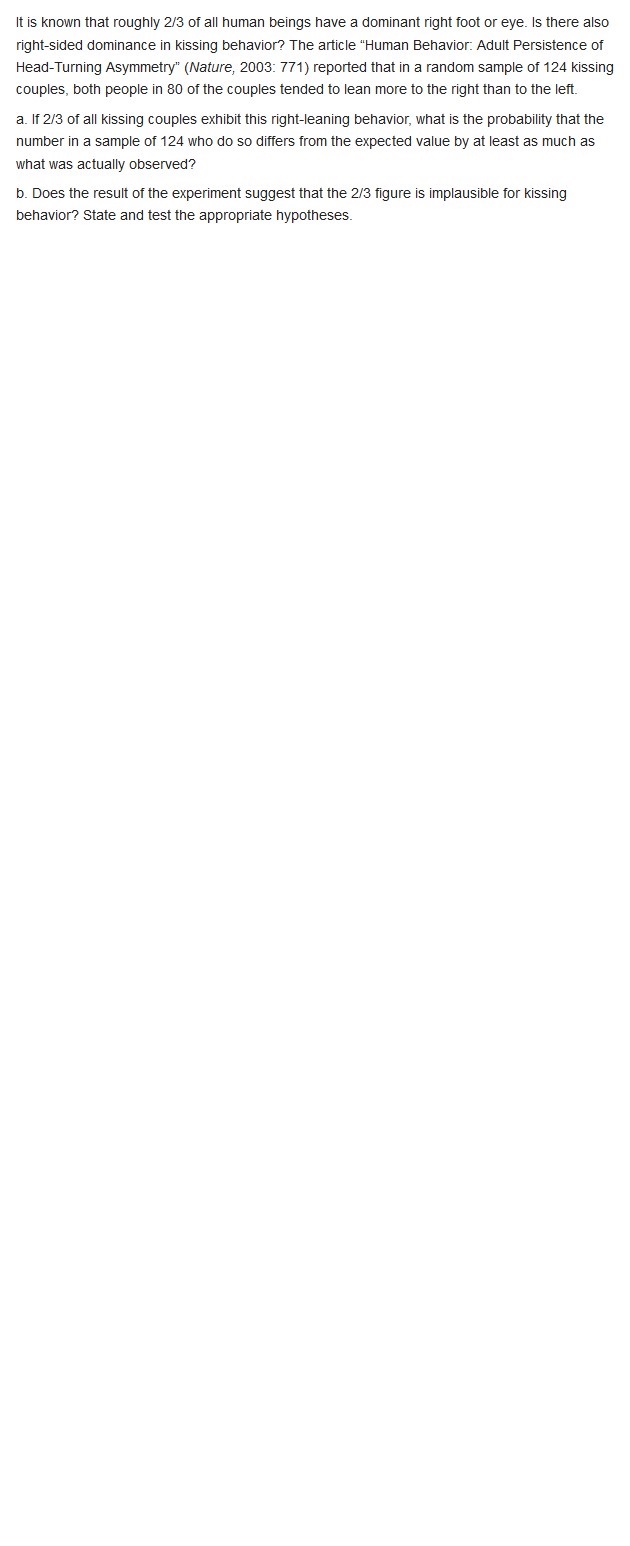
Refer to the data on x = liberation rate and y = NO, emission rate given in Exercise 19. a. Does the simple linear regression model specify a useful relationship between the two rates? Use the appropriate test procedure to obtain information about the P-value, and then reach a conclusion at significance level .01. b. Compute a 95% CI for the expected change in emission rate associated with a 10 MBtu/hr-ftz increase in liberation rate. Reference exercise 19 The following data is representative of that reported in the article "An Experimental Correlation of Oxides of Nitrogen Emissions from Power Boilers Based on Field Data" (J. of Engr. for Power, July 1973: 165-170), with x = burner-area liberation rate (MBtu/hr-f+2) and y = NO, emission rate (ppm): X 100 125 125 150 150 200 200 y 150 140 180 210 190 320 280 X 250 250 300 300 350 400 400 y 400 430 440 390 600 610 670 a. Assuming that the simple linear regression model is valid, obtain the least squares estimate of the true regression line. b. What is the estimate of expected NO, emission rate when burner area liberation rate equals 225? c. Estimate the amount by which you expect NO, emission rate to change when burner area liberation rate is decreased by 50. d. Would you use the estimated regression line to predict emission rate for a liberation rate of 500? Why or why not?Toughness and fibrousness of asparagus are major determinants of quality. This was the focus of a study reported in "Post-Harvest Glyphosphate Application Reduces Toughening, Fiber Content, and Lignification of Stored Asparagus Spears" (J. of the Amer. Soc. of Hort. Science, 1988: 569-572). The article reported the accompanying data (read from a graph) on x = shear force (kg) and y = percent fiber dry weight. x 46 48 55 57 60 72 81 85 94 y 2.18 2.10 2.13 2.28 2.34 2.53 2.28 2.62 2.63 r 109 121 132 137 148 149 184 185 187 y 2.50 2.66 2.79 2.80 3.01 2.98 3.34 3.49 3.26 n = 18, Ex; = 1950, Ex? = 251,970, Ey; = 47.92, Ey? = 130.6074, ExAy; = 5530.92 a. Calculate the value of the sample correlation coefficient. Based on this value, how would you describe the nature of the relationship between the two variables? b. If a first specimen has a larger value of shear force than does a second specimen, what tends to be true of percent dry fiber weight for the two specimens? c. If shear force is expressed in pounds, what happens to the value of r? Why? d. If the simple linear regression model were fit to this data, what proportion of observed variation in percent fiber dry weight could be explained by the model relationship? e. Carry out a test at significance level .01 to decide whether there is a positive linear association between the two variables.Have you ever been frustrated because you could not get a container of some sort to release the last bit of its contents? The article "Shake, Rattle, and Squeeze: How Much Is Left in That Container?" (Consumer Reports, May 2009: 8) reported on an investigation of this issue for various consumer products. Suppose five 6.0 oz tubes of toothpaste of a particular brand are randomly selected and squeezed until no more toothpaste will come out. Then each tube is cut open and the amount remaining is weighed, resulting in the following data (consistent with what the cited article reported): .53, .65, .46, .50, .37. Does it appear that the true average amount left is less than 10% of the advertised net contents? a. Check the validity of any a necessary for testing the appr ate hypotheses. b. Carry out a test of the appropriate hypotheses using a significance level of .05. Would your conclusion change if a significance level of .01 had been used? c. Describe in context type I and II errors, and say which error might have been made in reaching a conclusion.Polymer composite materials have gained popularity because they have high strength to weight ratios and are relatively easy and inexpensive to manufacture. However, their nondegradable nature has prompted development of environmentally friendly composites using natural materials. The article "Properties of Waste Silk Shed Fibertcellulose Green Composite Films" 1. of Composite Materials, 2012: 123-12?) reported that for a sample of 10 specimens with 2% ber content, the sample mean tensile strength (MPa) was 51.3 and the sample standard deviation was 1.2. Suppose the true average strength forms bers (pure cellulose) is known to be 48 MPa. Does the data provide compelling evidence for concluding that true average strength for the WScheiIulose composite exceeds this value? It is known that roughly 2:3 of all human beings have a dominant right foot or eye. Is there also rightsided dominance in kissing behavior? The article "Human Behavior: Adult Persistence of Head-Turning Asymmetry" (Nature, 2003: TH) reported that in a random sample of 124 kissing couples, both people in 80 of the couples tended to lean more to the right than to the lett. a. If 2!? of all kissing couples exhibit this rightleaning behavior, what is the probability that the number in a sample of 124 who do so differs from the expected value by at least as much as what was actually observed? b. Does the result of the experiment suggest that the 2K? figure is impiausible for kissing behavior? State and test the appropriate hypotheses
Step by Step Solution
There are 3 Steps involved in it

Get step-by-step solutions from verified subject matter experts