

Question: Answer these numericals The efficiency ratio for a steel specimen immersed in a phosphating tank is the weight of the phosphate coating divided by the
Answer these numericals
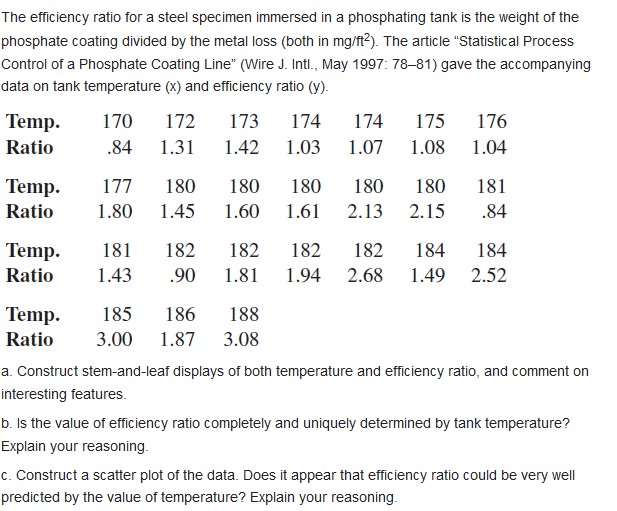


The efficiency ratio for a steel specimen immersed in a phosphating tank is the weight of the phosphate coating divided by the metal loss (both in mg/ft-). The article "Statistical Process Control of a Phosphate Coating Line" (Wire J. Intl., May 1997: 78-81) gave the accompanying data on tank temperature (x) and efficiency ratio (y). Temp. 170 172 173 174 174 175 176 Ratio .84 1.31 1.42 1.03 1.07 1.08 1.04 Temp. 177 180 180 180 180 180 181 Ratio 1.80 1.45 1.60 1.61 2.13 2.15 .84 Temp. 181 182 182 182 182 184 184 Ratio 1.43 90 1.81 1.94 2.68 1.49 2.52 Temp. 185 186 188 Ratio 3.00 1.87 3.08 a. Construct stem-and-leaf displays of both temperature and efficiency ratio, and comment on interesting features. b. Is the value of efficiency ratio completely and uniquely determined by tank temperature? Explain your reasoning. c. Construct a scatter plot of the data. Does it appear that efficiency ratio could be very well predicted by the value of temperature? Explain your reasoningPolymer composite materials have gained popularity because they have high strength to weight ratios and are relatively easy and inexpensive to manufacture. However, their nondegradable nature has prompted development of environmentally friendly composites using natural materials. The article "Properties of Waste Silk Shed Fibertcellulose Green Composite Films" 1. of Composite Materials, 2012: 123-12?) reported that for a sample of 10 specimens with 2% ber content, the sample mean tensile strength (MPa) was 51.3 and the sample standard deviation was 1.2. Suppose the true average strength forms bers (pure cellulose) is known to be 48 MPa. Does the data provide compelling evidence for concluding that true average strength for the WScheiIulose composite exceeds this value? With domestic sources of building supplies running low several years ago, roughly 60,000 homes were built with imported Chinese drywall. According to the article "Report Links Chinese Drywall to Home Problems" (New York Times, Nov. 24, 2009), federal investigators identified a strong association between chemicals in the drywall and electrical problems, and there is also strong evidence of respiratory difficulties due to the emission of hydrogen sulfide gas. An extensive examination of 51 homes found that 41 had such problems. Suppose these 51 were randomly sampled from the population of all homes having Chinese drywall. a. Does the data provide strong evidence for concluding that more than 50% of all homes with Chinese drywall have electrical/environmental problems? Carry out a test of hypotheses using a = .01. b. Calculate a lower confidence bound using a confidence level of 99% for the percentage of all such homes that have electrical/environmental problems. c. If it is actually the case that 80% of all such homes have problems, how likely is it that the test of (a) would not conclude that more than 50% do?When X1. X2, ... . X are independent Poisson variables, each with parameter p, and n is large, the sample mean X X,. .. . . X, has approximately a normal distribution with ,and Y . This implies that U = E(X) has approximately a standard normal distribution. For testing Ho: J = Ho, we can replace p by Ho in the equation for Z to obtain a test statistic. This statistic is actually preferred to the large- sample statistic with denominator V(X ) = w/m. (when the Xis are Poisson) because it is tailored explicitly to the Poisson assumption. If the number of requests for consulting received by a certain statistician during a 5-day work week has a Poisson distribution and the total number of consulting requests during a 36-week period is 160, does this suggest that the true average number of weekly requests exceeds 4.0? Test using a = .02.An article in the Nov. 11, 2005, issue of the San Luis Obispo Tribune reported that researchers making random purchases at California Wal-Mart stores found scanners coming up with the wrong price 8.3% of the time. Suppose this was based on 200 purchases. The National Institute for Standards and Technology says that in the long run at most two out of every 100 items should have incorrectly scanned prices. a. Develop a test procedure with a significance level of (approximately) .05, and then carry out the test to decide whether the NIST benchmark is not satisfied. b. For the test procedure you employed in (a), what is the probability of deciding that the NIST benchmark has been satisfied when in fact the mistake rate is 5%
Step by Step Solution
There are 3 Steps involved in it

Get step-by-step solutions from verified subject matter experts