

Question: Answer this question for me please explain. U-learn University uses ac chart to monitor student complaints per week. Complaints have been recorded over the past
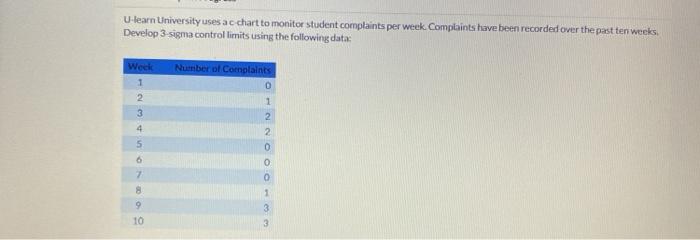
Answer this question for me please explain. 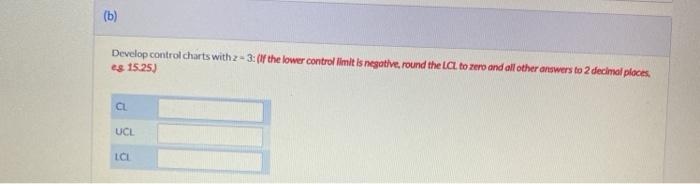
Step by Step Solution
There are 3 Steps involved in it
1 Expert Approved Answer
Step: 1 Unlock

Question Has Been Solved by an Expert!
Get step-by-step solutions from verified subject matter experts
Step: 2 Unlock
Step: 3 Unlock