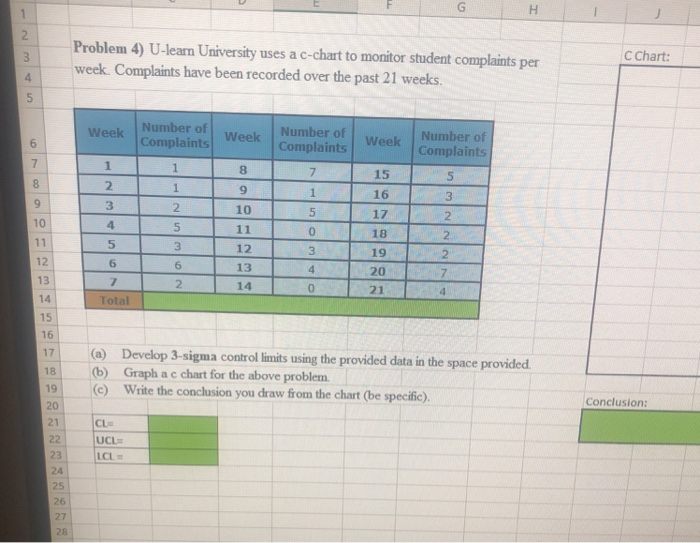
Question: C Chart: Problem 4) U-learn University uses a c-chart to monitor student complaints per week. Complaints have been recorded over the past 21 weeks. Number

C Chart: Problem 4) U-learn University uses a
C Chart: Problem 4) U-learn University uses a c-chart to monitor student complaints per week. Complaints have been recorded over the past 21 weeks. Number of Week Week 1 2 3 4 5 Number of Week Number of Complaints Complaints Complaints 18 155 I 1 I 9 1 1 1 16 3 2 105 17 2 5 11 0 | 18 2 I 3 I 12 I 3 T 19 T 2. 13 4 2017 21 Total (a) (b) (c) Develop 3-sigma control limits using the provided data in the space provided Graph a c chart for the above problem Write the conclusion you draw from the chart (be specific). Conclusion: C Chart: laints per the space provided Conclusion

Step by Step Solution

There are 3 Steps involved in it

1 Expert Approved Answer
Step: 1 Unlock blur-text-image
Question Has Been Solved by an Expert!

Get step-by-step solutions from verified subject matter experts

Step: 2 Unlock
Step: 3 Unlock

Students Have Also Explored These Related General Management Questions!