

Question: Answer this step by step . Table 10-3 Factors for three-sigma control limits for X- and R-charts. Factors for R-Charts Number of Observations in Factor
Answer this step by step .
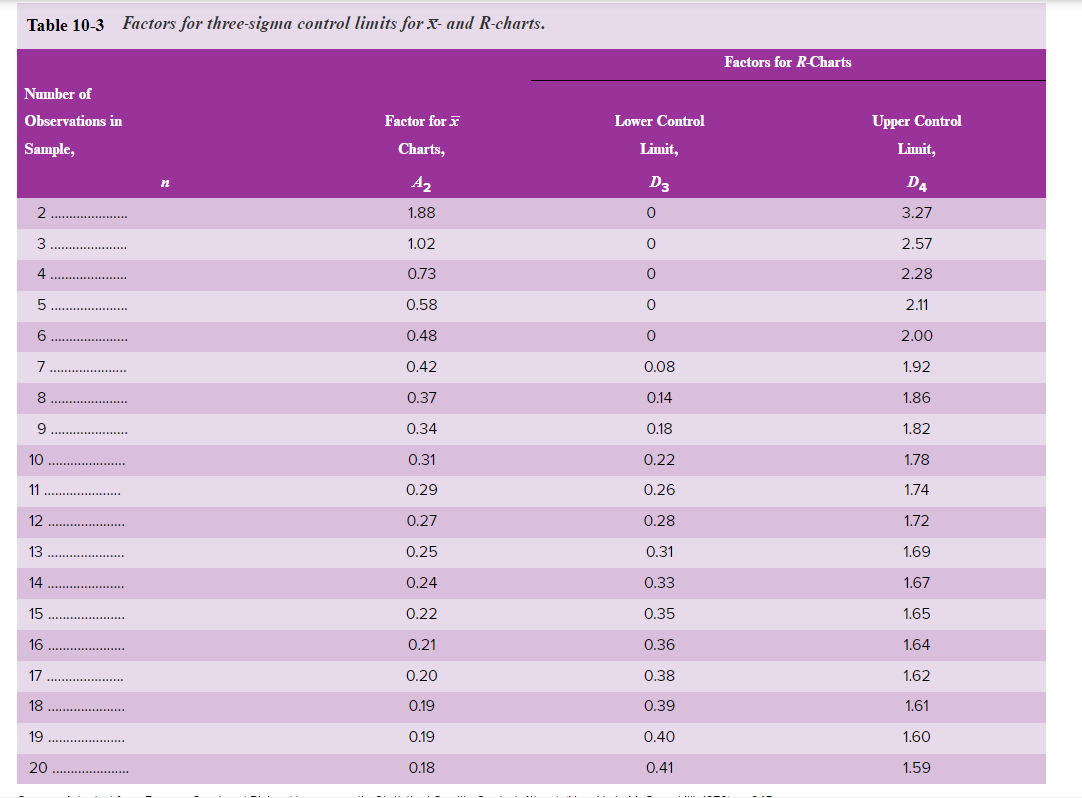
Table 10-3 Factors for three-sigma control limits for X- and R-charts. Factors for R-Charts Number of Observations in Factor for X Lower Control Upper Control Sample, Charts, Limit, Limit, n AZ D3 D4 1.88 O 3.27 1.02 O 2.57 0.73 0 2.28 0.58 O 2.11 0.48 O 2.00 0.42 0.08 1.92 0.37 0.14 1.86 0.34 0.18 1.82 10 . 0.31 0.22 1.78 0.29 0.26 1.74 12 0.27 0.28 1.72 0.25 0.31 1.69 0.24 0.33 1.67 15 am 0.22 0.35 1.65 16 0.21 0.36 1.64 0.20 0.38 1.62 0.19 0.39 1.61 19 0.19 0.40 1.60 0.18 0.41 1.59
Step by Step Solution
There are 3 Steps involved in it
1 Expert Approved Answer
Step: 1 Unlock

Question Has Been Solved by an Expert!
Get step-by-step solutions from verified subject matter experts
Step: 2 Unlock
Step: 3 Unlock