

Question: TABLE 10.3 Factors for three-sigma control limits for and R charts Source: Adapted from Eugene Grant and Richard Leavenworth, Statistical Quality Control, 5th ed. 1980
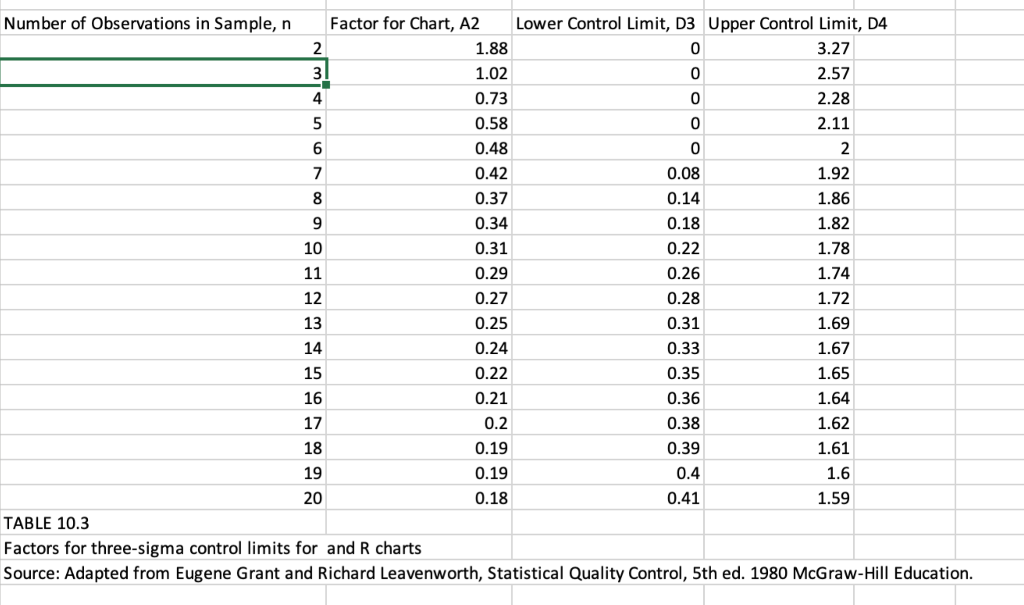
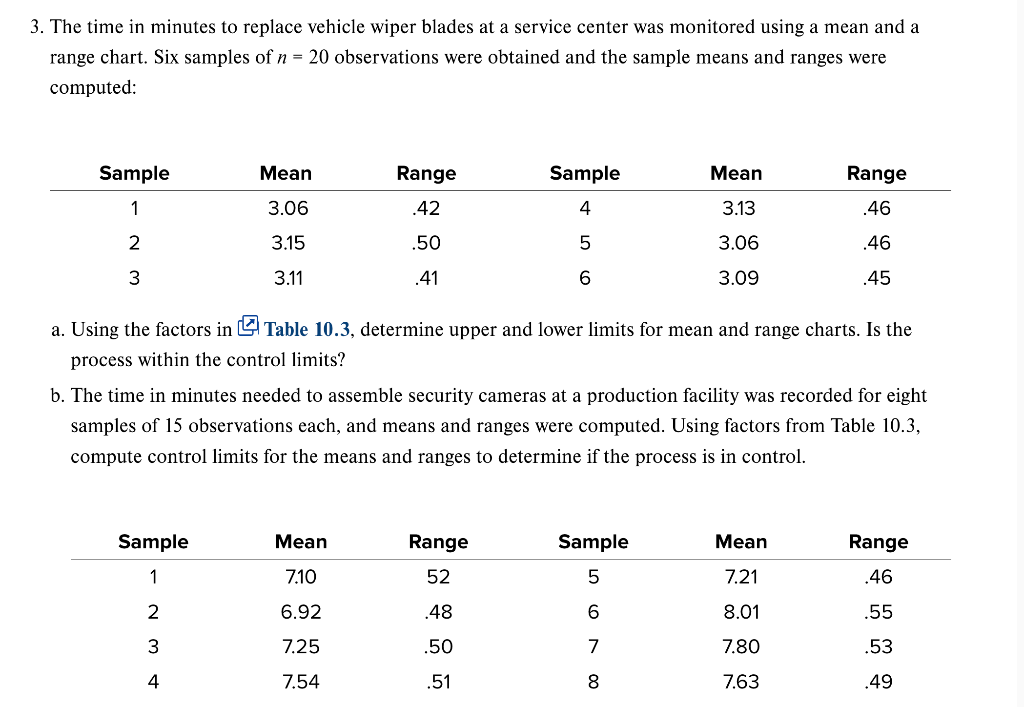
TABLE 10.3 Factors for three-sigma control limits for and R charts Source: Adapted from Eugene Grant and Richard Leavenworth, Statistical Quality Control, 5th ed. 1980 McGraw-Hill Education. 3. The time in minutes to replace vehicle wiper blades at a service center was monitored using a mean and a range chart. Six samples of n=20 observations were obtained and the sample means and ranges were computed: a. Using the factors in Table 10.3, determine upper and lower limits for mean and range charts. Is the process within the control limits? b. The time in minutes needed to assemble security cameras at a production facility was recorded for eight samples of 15 observations each, and means and ranges were computed. Using factors from Table 10.3, compute control limits for the means and ranges to determine if the process is in control
Step by Step Solution
There are 3 Steps involved in it

Get step-by-step solutions from verified subject matter experts