

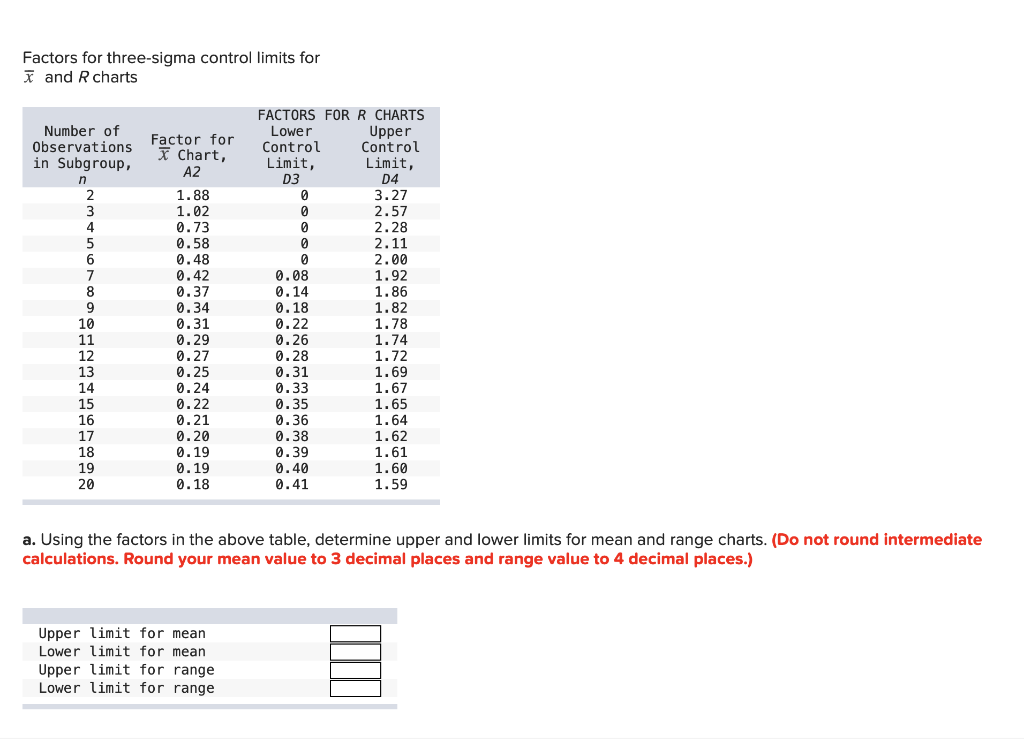
Question: Factors for three-sigma control limits for X and R charts Number of Observations in Subgroup, 6 0.08 8 Factor for X Chart, A2 1.88 1.02
Step by Step Solution
There are 3 Steps involved in it
1 Expert Approved Answer
Step: 1 Unlock

Question Has Been Solved by an Expert!
Get step-by-step solutions from verified subject matter experts
Step: 2 Unlock
Step: 3 Unlock