

Question: ANSWER USING MATLAB USE THE FPLOT COMMAND 11. Plot the function f(x) = -12 in the domain -1 5x5 7. Notice that x-x-6 the function
ANSWER USING MATLAB
USE THE FPLOT COMMAND
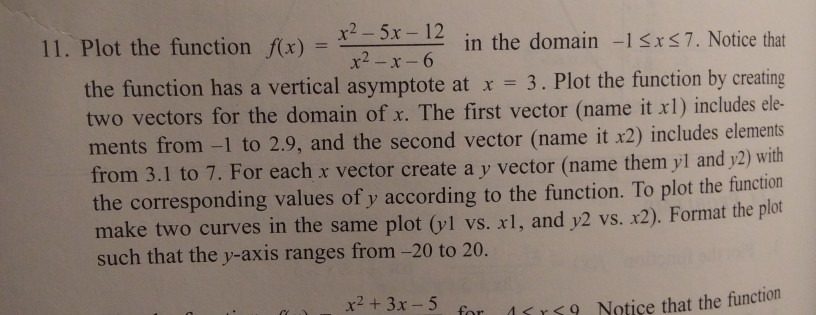
11. Plot the function f(x) = -12 in the domain -1 5x5 7. Notice that x-x-6 the function has a vertical asymptote at x = 3. Plot the function by creating two vectors for the domain of x. The first vector (name it xl) includes ele- ments from-1 to 2.9, and the second vector (name it x2) includes elements from 3.1 to 7. For each x vector create a y vector (name them yl and y2) with the corresponding values of y according to the function. To plot the function make two curves in the same plot (yl vs. x1, and y2 vs. x2). Format the plot such that the v-axis ranges from -20 to 20. Notice that the function
Step by Step Solution
There are 3 Steps involved in it
1 Expert Approved Answer
Step: 1 Unlock

Question Has Been Solved by an Expert!
Get step-by-step solutions from verified subject matter experts
Step: 2 Unlock
Step: 3 Unlock