

Question: Answer using R. Use dataset: ecomm.df to answer questions. You do not need to submit any graphs you produce--just your code and output text. 1.
Answer using R. Use dataset: ecomm.df
to answer questions. You do not need to submit any graphs you produce--just your code and output text.
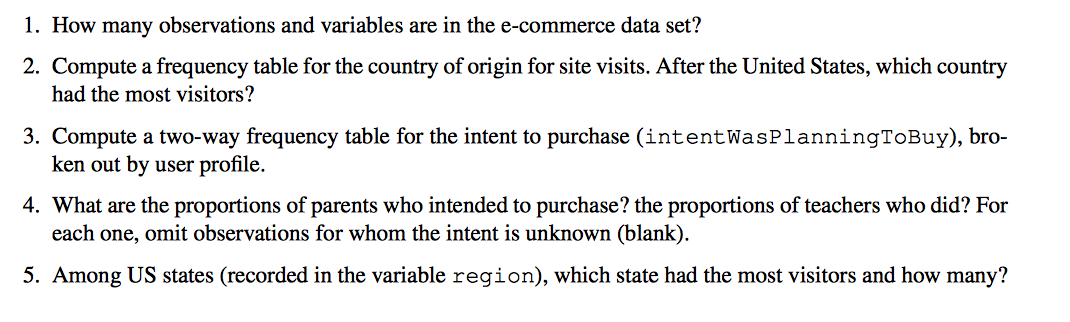
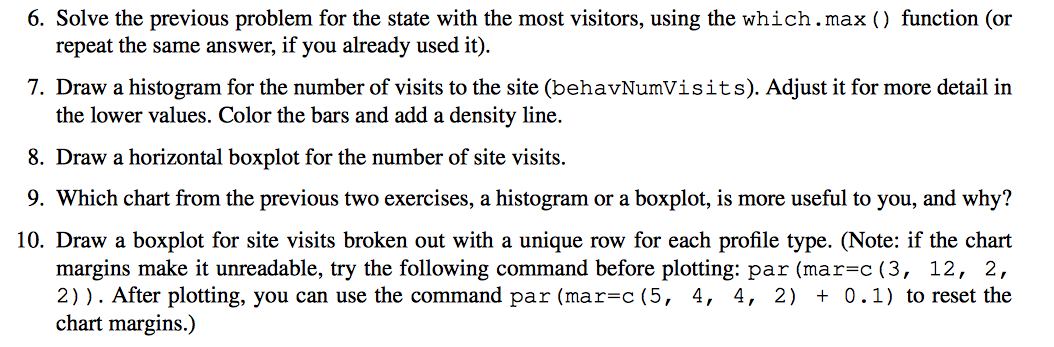
1. How many observations and variables are in the e-commerce data set? 2. Compute a frequency table for the country of origin for site visits. After the United States, which country had the most visitors? 3. Compute a two-way frequency table for the intent to purchase (intentWasPlanningToBuy), bro- ken out by user profile. 4. What are the proportions of parents who intended to purchase? the proportions of teachers who did? For each one, omit observations for whom the intent is unknown (blank). 5. Among US states (recorded in the variable region), which state had the most visitors and how many? 6. Solve the previous problem for the state with the most visitors, using the which.max () function (or repeat the same answer, if you already used it). 7. Draw a histogram for the number of visits to the site (behavNumVisits). Adjust it for more detail in the lower values. Color the bars and add a density line. 8. Draw a horizontal boxplot for the number of site visits. 9. Which chart from the previous two exercises, a histogram or a boxplot, is more useful to you, and why? 10. Draw a boxplot for site visits broken out with a unique row for each profile type. (Note: if the chart margins make it unreadable, try the following command before plotting: par (mar=c(3, 12, 2, 2)). After plotting, you can use the command par (mar=c(5, 4, 4, 2) + 0.1) to reset the chart margins.) 1. How many observations and variables are in the e-commerce data set? 2. Compute a frequency table for the country of origin for site visits. After the United States, which country had the most visitors? 3. Compute a two-way frequency table for the intent to purchase (intentWasPlanningToBuy), bro- ken out by user profile. 4. What are the proportions of parents who intended to purchase? the proportions of teachers who did? For each one, omit observations for whom the intent is unknown (blank). 5. Among US states (recorded in the variable region), which state had the most visitors and how many? 6. Solve the previous problem for the state with the most visitors, using the which.max () function (or repeat the same answer, if you already used it). 7. Draw a histogram for the number of visits to the site (behavNumVisits). Adjust it for more detail in the lower values. Color the bars and add a density line. 8. Draw a horizontal boxplot for the number of site visits. 9. Which chart from the previous two exercises, a histogram or a boxplot, is more useful to you, and why? 10. Draw a boxplot for site visits broken out with a unique row for each profile type. (Note: if the chart margins make it unreadable, try the following command before plotting: par (mar=c(3, 12, 2, 2)). After plotting, you can use the command par (mar=c(5, 4, 4, 2) + 0.1) to reset the chart margins.)
Step by Step Solution
There are 3 Steps involved in it

Get step-by-step solutions from verified subject matter experts