

Question: Ap Stats question!Hard! Help!!! The following histograms summarize the teaching year for the teachers at two high schools, A and B. High School A High
Ap Stats question!Hard! Help!!!
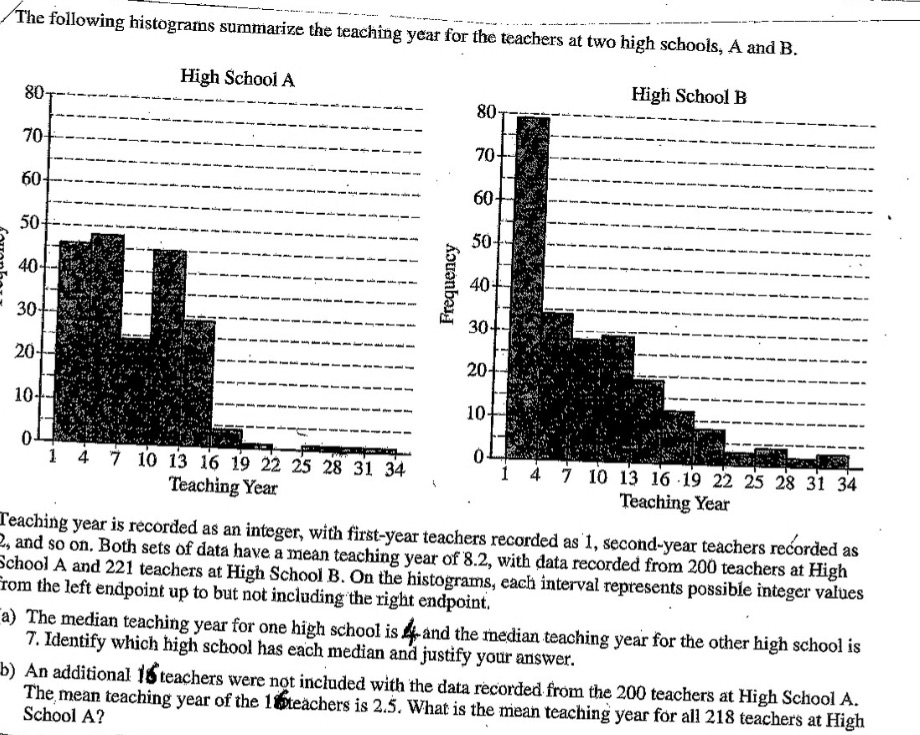
The following histograms summarize the teaching year for the teachers at two high schools, A and B. High School A High School B 80- 80- 70 70 60 60 50+ Frequency 50 40 40 30- 30 20- 20- 10 10 4 7 10 13 16 19 22 25 28 31 34 4 7 10 13 16 19 22 25 28 31 34 Teaching Year Teaching Year Teaching year is recorded as an integer, with first-year teachers recorded as 1, second-year teachers recorded as , and so on. Both sets of data have a mean teaching year of 8.2, with data recorded from 200 teachers at High School A and 221 teachers at High School B. On the histograms, each interval represents possible integer values rom the left endpoint up to but not including the right endpoint. a) The median teaching year for one high school is 4-and the median teaching year for the other high school is 7. Identify which high school has each median and justify your answer. b) An additional 16 teachers were not included with the data recorded from the 200 teachers at High School A. School A? The mean teaching year of the 1 toteachers is 2.5. What is the mean teaching year for all 218 teachers at High
Step by Step Solution
There are 3 Steps involved in it

Get step-by-step solutions from verified subject matter experts