

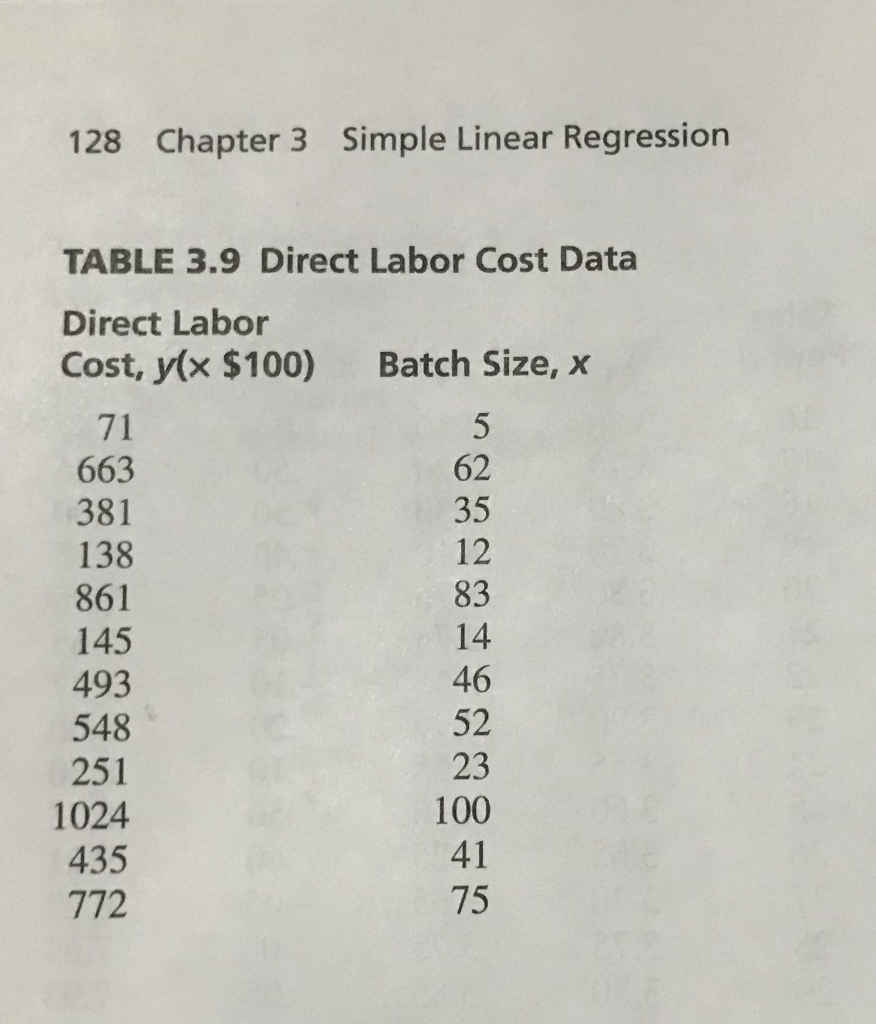
Question: a.Plot the data in Table 3.9 and fit a linear trend line and display the regression equation and R-squared. b. Compute the regression coefficients and
a.Plot the data in Table 3.9 and fit a linear trend line and display the regression equation and R-squared.
b. Compute the regression coefficients and compare your results with part a.
c. Fit a regression model using Excels regression function and compare your results with parts a and b.
Step by Step Solution
There are 3 Steps involved in it
1 Expert Approved Answer
Step: 1 Unlock

Question Has Been Solved by an Expert!
Get step-by-step solutions from verified subject matter experts
Step: 2 Unlock
Step: 3 Unlock