

Question: Appendix: Standard Normal Loss Function Table (continued) Standard Normal Loss Function Table, L(z) (Concluded) begin{tabular}{|c|c|c|c|c|c|c|c|c|c|c|} hlinez & 0.00 & 0.01 & 0.02 & 0.03 &
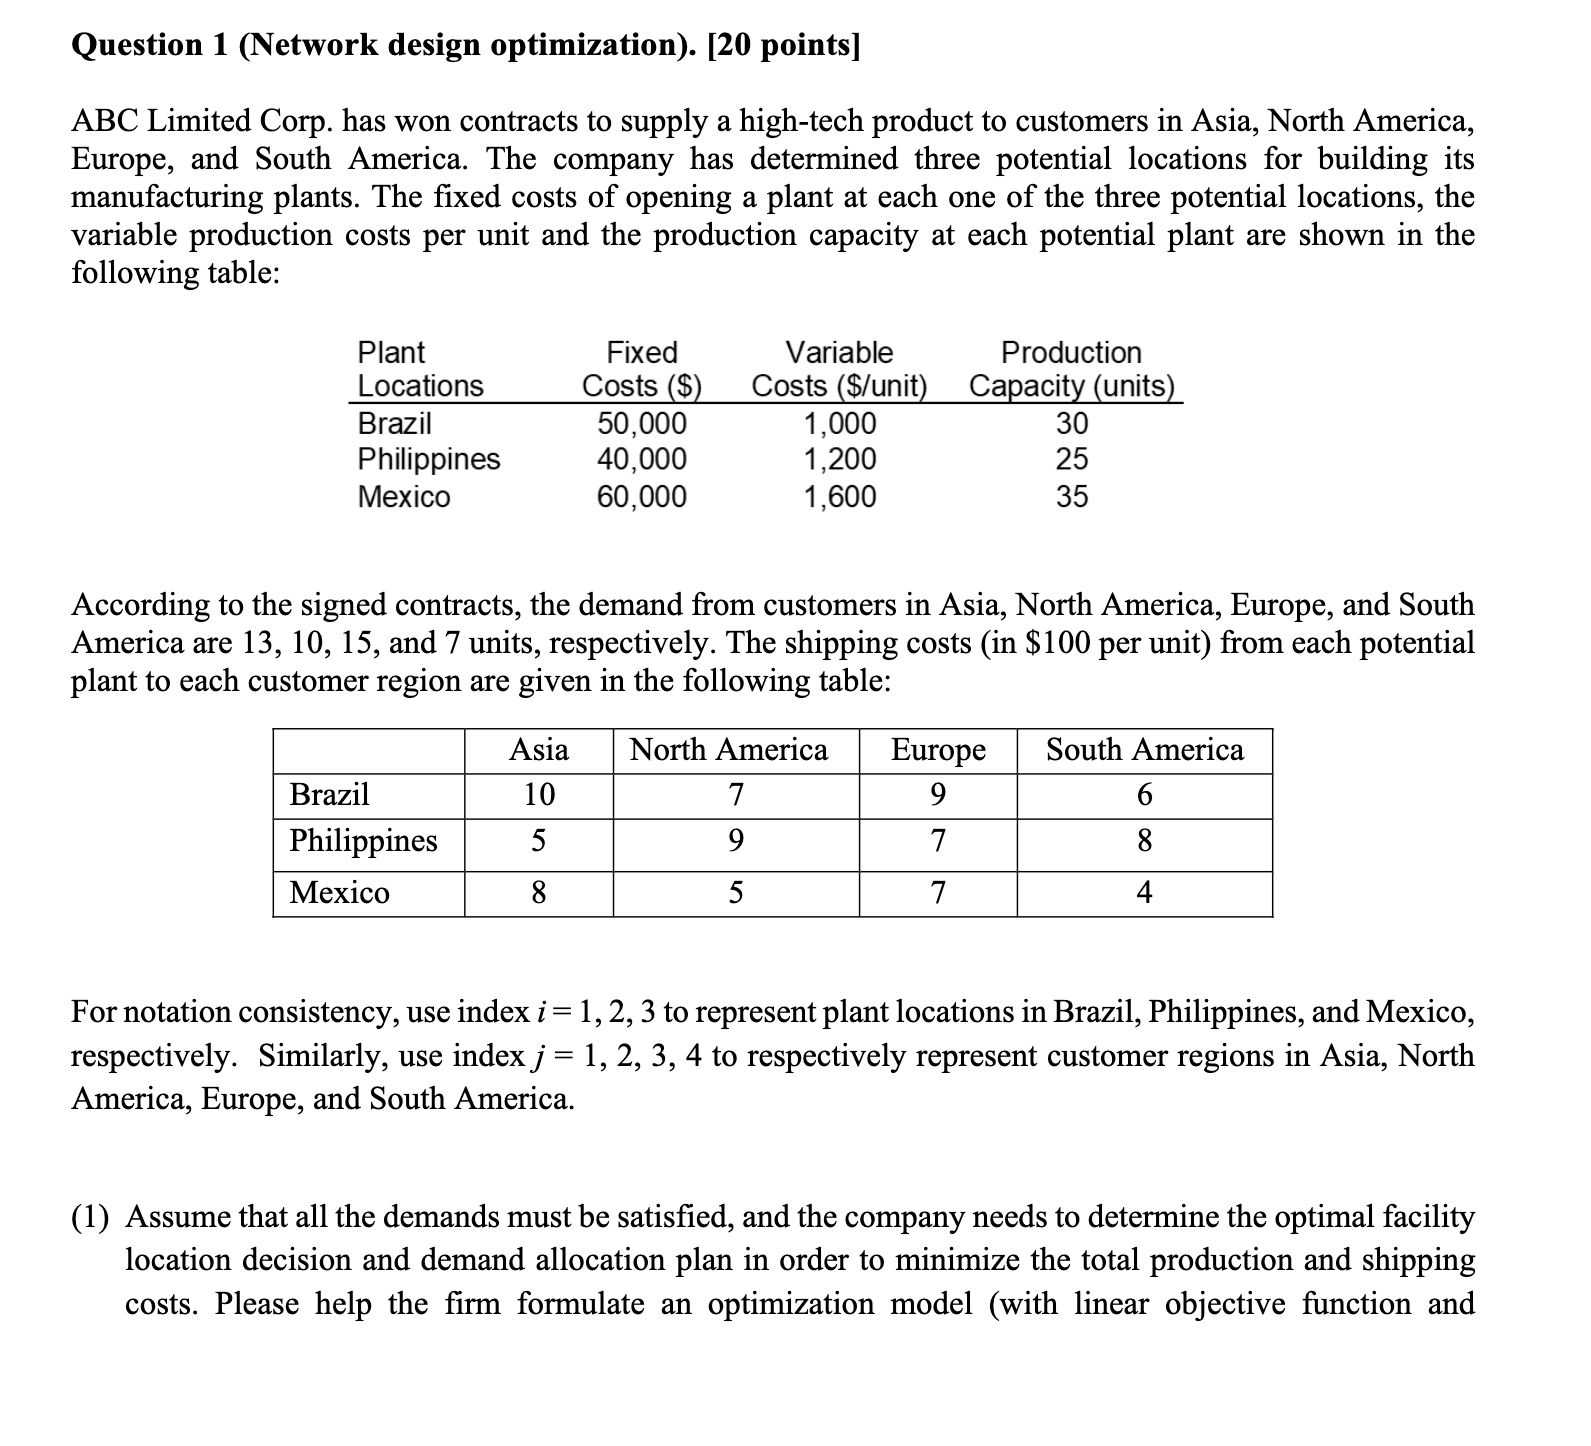
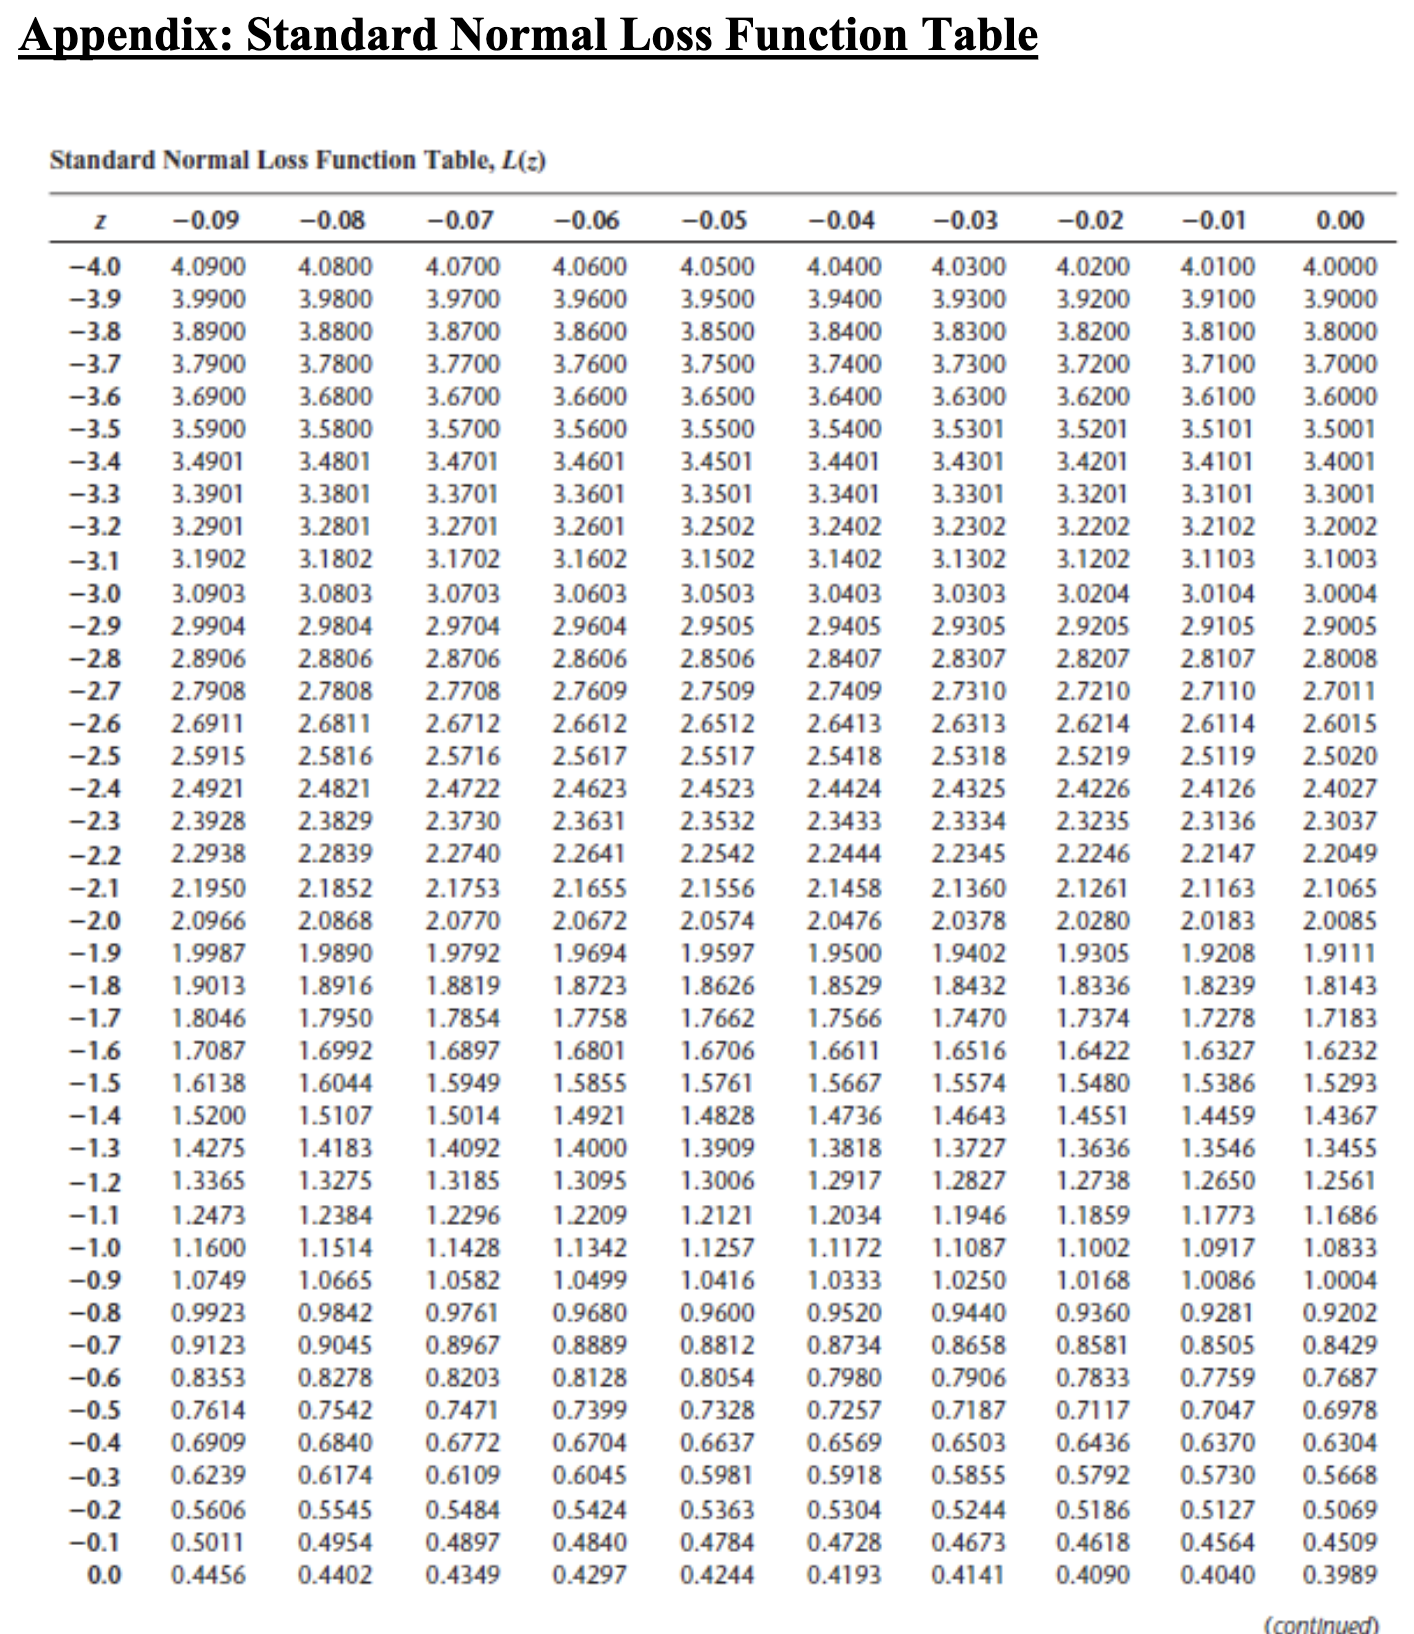
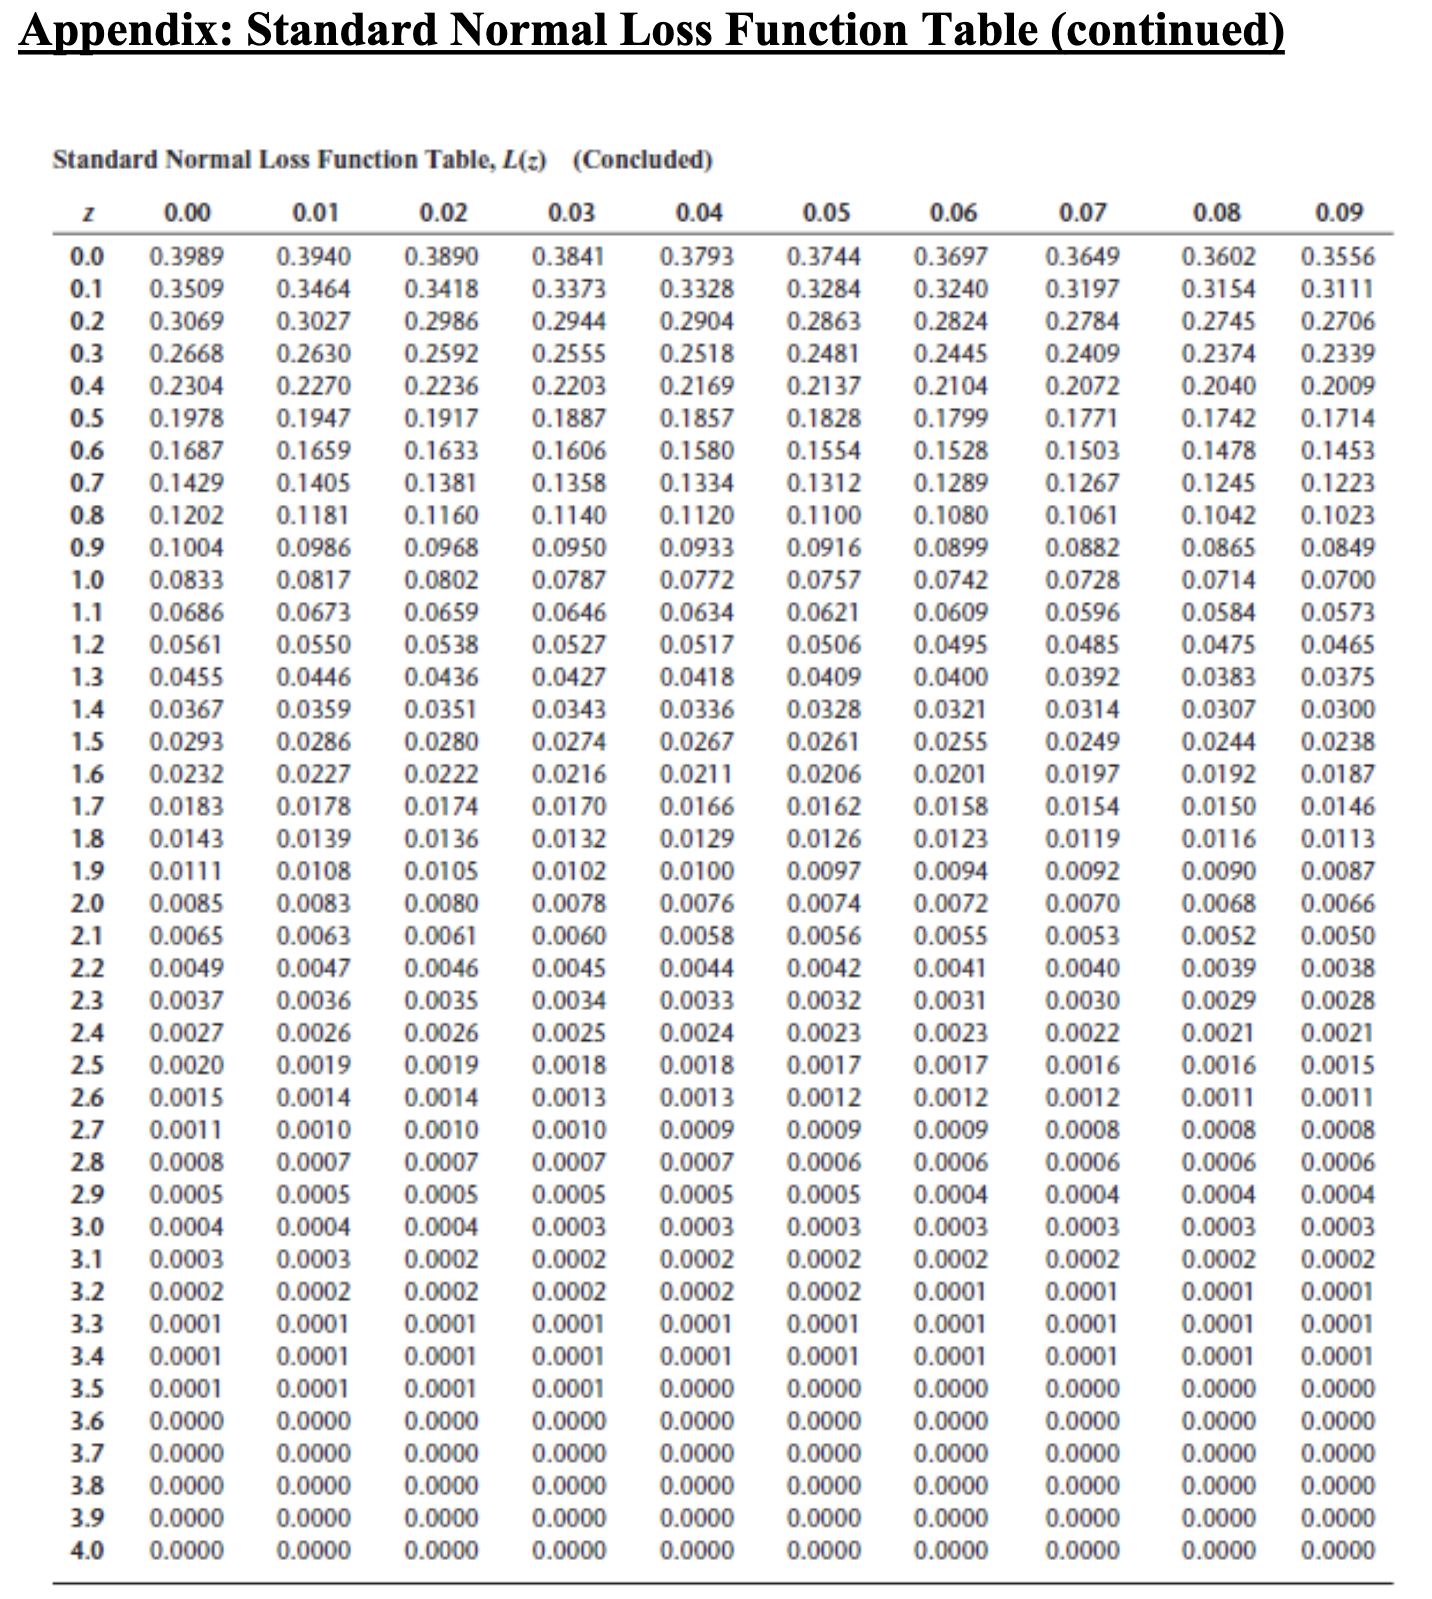
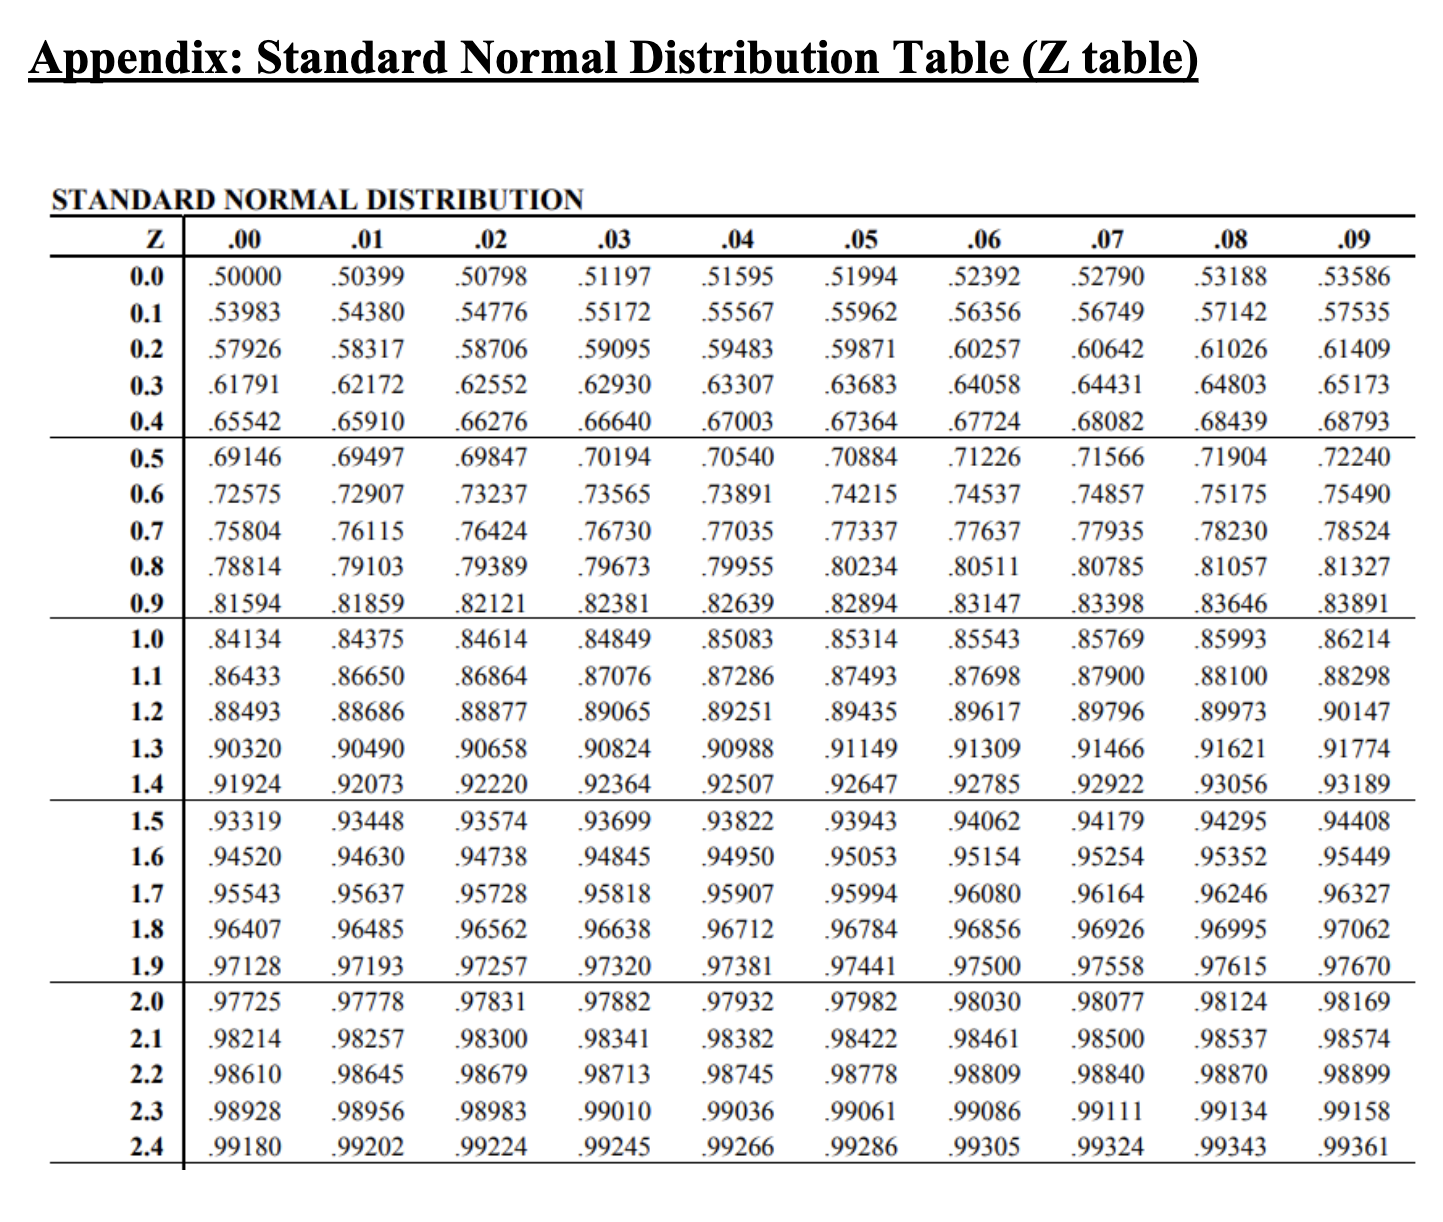
Appendix: Standard Normal Loss Function Table (continued) Standard Normal Loss Function Table, L(z) (Concluded) \begin{tabular}{|c|c|c|c|c|c|c|c|c|c|c|} \hlinez & 0.00 & 0.01 & 0.02 & 0.03 & 0.04 & 0.05 & 0.06 & 0.07 & 0.08 & 0.09 \\ \hline 0.0 & 0.3989 & 0.3940 & 0.3890 & 0.3841 & 0.3793 & 0.3744 & 0.3697 & 0.3649 & 0.3602 & 0.3556 \\ \hline 0.1 & 0.3509 & 0.3464 & 0.3418 & 0.3373 & 0.3328 & 0.3284 & 0.3240 & 0.3197 & 0.3154 & 0.3111 \\ \hline 0.2 & 0.3069 & 0.3027 & 0.2986 & 0.2944 & 0.2904 & 0.2863 & 0.2824 & 0.2784 & 0.2745 & 0.2706 \\ \hline 0.3 & 0.2668 & 0.2630 & 0.2592 & 0.2555 & 0.2518 & 0.2481 & 0.2445 & 0.2409 & 0.2374 & 0.2339 \\ \hline 0.4 & 0.2304 & 0.2270 & 0.2236 & 0.2203 & 0.2169 & 0.2137 & 0.2104 & 0.2072 & 0.2040 & 0.2009 \\ \hline 0.5 & 0.1978 & 0.1947 & 0.1917 & 0.1887 & 0.1857 & 0.1828 & 0.1799 & 0.1771 & 0.1742 & 0.1714 \\ \hline 0.6 & 0.1687 & 0.1659 & 0.1633 & 0.1606 & 0.1580 & 0.1554 & 0.1528 & 0.1503 & 0.1478 & 0.1453 \\ \hline 0.7 & 0.1429 & 0.1405 & 0.1381 & 0.1358 & 0.1334 & 0.1312 & 0.1289 & 0.1267 & 0.1245 & 0.1223 \\ \hline 0.8 & 0.1202 & 0.1181 & 0.1160 & 0.1140 & 0.1120 & 0.1100 & 0.1080 & 0.1061 & 0.1042 & 0.1023 \\ \hline 0.9 & 0.1004 & 0.0986 & 0.0968 & 0.0950 & 0.0933 & 0.0916 & 0.0899 & 0.0882 & 0.0865 & 0.0849 \\ \hline 1.0 & 0.0833 & 0.0817 & 0.0802 & 0.0787 & 0.0772 & 0.0757 & 0.0742 & 0.0728 & 0.0714 & 0.0700 \\ \hline 1.1 & 0.0686 & 0.0673 & 0.0659 & 0.0646 & 0.0634 & 0.0621 & 0.0609 & 0.0596 & 0.0584 & 0.0573 \\ \hline 1.2 & 0.0561 & 0.0550 & 0.0538 & 0.0527 & 0.0517 & 0.0506 & 0.0495 & 0.0485 & 0.0475 & 0.0465 \\ \hline 1.3 & 0.0455 & 0.0446 & 0.0436 & 0.0427 & 0.0418 & 0.0409 & 0.0400 & 0.0392 & 0.0383 & 0.0375 \\ \hline 1.4 & 0.0367 & 0.0359 & 0.0351 & 0.0343 & 0.0336 & 0.0328 & 0.0321 & 0.0314 & 0.0307 & 0.0300 \\ \hline 1.5 & 0.0293 & 0.0286 & 0.0280 & 0.0274 & 0.0267 & 0.0261 & 0.0255 & 0.0249 & 0.0244 & 0.0238 \\ \hline 1.6 & 0.0232 & 0.0227 & 0.0222 & 0.0216 & 0.0211 & 0.0206 & 0.0201 & 0.0197 & 0.0192 & 0.0187 \\ \hline 1.7 & 0.0183 & 0.0178 & 0.0174 & 0.0170 & 0.0166 & 0.0162 & 0.0158 & 0.0154 & 0.0150 & 0.0146 \\ \hline 1.8 & 0.0143 & 0.0139 & 0.0136 & 0.0132 & 0.0129 & 0.0126 & 0.0123 & 0.0119 & 0.0116 & 0.0113 \\ \hline 1.9 & 0.0111 & 0.0108 & 0.0105 & 0.0102 & 0.0100 & 0.0097 & 0.0094 & 0.0092 & 0.0090 & 0.0087 \\ \hline 2.0 & 0.0085 & 0.0083 & 0.0080 & 0.0078 & 0.0076 & 0.0074 & 0.0072 & 0.0070 & 0.0068 & 0.0066 \\ \hline 2.1 & 0.0065 & 0.0063 & 0.0061 & 0.0060 & 0.0058 & 0.0056 & 0.0055 & 0.0053 & 0.0052 & 0.0050 \\ \hline 2.2 & 0.0049 & 0.0047 & 0.0046 & 0.0045 & 0.0044 & 0.0042 & 0.0041 & 0.0040 & 0.0039 & 0.0038 \\ \hline 2.3 & 0.0037 & 0.0036 & 0.0035 & 0.0034 & 0.0033 & 0.0032 & 0.0031 & 0.0030 & 0.0029 & 0.0028 \\ \hline 2.4 & 0.0027 & 0.0026 & 0.0026 & 0.0025 & 0.0024 & 0.0023 & 0.0023 & 0.0022 & 0.0021 & 0.0021 \\ \hline 2.5 & 0.0020 & 0.0019 & 0.0019 & 0.0018 & 0.0018 & 0.0017 & 0.0017 & 0.0016 & 0.0016 & 0.0015 \\ \hline 2.6 & 0.0015 & 0.0014 & 0.0014 & 0.0013 & 0.0013 & 0.0012 & 0.0012 & 0.0012 & 0.0011 & 0.0011 \\ \hline 2.7 & 0.0011 & 0.0010 & 0.0010 & 0.0010 & 0.0009 & 0.0009 & 0.0009 & 0.0008 & 0.0008 & 0.0008 \\ \hline 2.8 & 0.0008 & 0.0007 & 0.0007 & 0.0007 & 0.0007 & 0.0006 & 0.0006 & 0.0006 & 0.0006 & 0.0006 \\ \hline 2.9 & 0.0005 & 0.0005 & 0.0005 & 0.0005 & 0.0005 & 0.0005 & 0.0004 & 0.0004 & 0.0004 & 0.0004 \\ \hline 3.0 & 0.0004 & 0.0004 & 0.0004 & 0.0003 & 0.0003 & 0.0003 & 0.0003 & 0.0003 & 0.0003 & 0.0003 \\ \hline 3.1 & 0.0003 & 0.0003 & 0.0002 & 0.0002 & 0.0002 & 0.0002 & 0.0002 & 0.0002 & 0.0002 & 0.0002 \\ \hline 3.2 & 0.0002 & 0.0002 & 0.0002 & 0.0002 & 0.0002 & 0.0002 & 0.0001 & 0.0001 & 0.0001 & 0.0001 \\ \hline 3.3 & 0.0001 & 0.0001 & 0.0001 & 0.0001 & 0.0001 & 0.0001 & 0.0001 & 0.0001 & 0.0001 & 0.0001 \\ \hline 3.4 & 0.0001 & 0.0001 & 0.0001 & 0.0001 & 0.0001 & 0.0001 & 0.0001 & 0.0001 & 0.0001 & 0.0001 \\ \hline 3.5 & 0.0001 & 0.0001 & 0.0001 & 0.0001 & 0.0000 & 0.0000 & 0.0000 & 0.0000 & 0.0000 & 0.0000 \\ \hline 3.6 & 0.0000 & 0.0000 & 0.0000 & 0.0000 & 0.0000 & 0.0000 & 0.0000 & 0.0000 & 0.0000 & 0.0000 \\ \hline 3.7 & 0.0000 & 0.0000 & 0.0000 & 0.0000 & 0.0000 & 0.0000 & 0.0000 & 0.0000 & 0.0000 & 0.0000 \\ \hline 3.8 & 0.0000 & 0.0000 & 0.0000 & 0.0000 & 0.0000 & 0.0000 & 0.0000 & 0.0000 & 0.0000 & 0.0000 \\ \hline 3.9 & 0.0000 & 0.0000 & 0.0000 & 0.0000 & 0.0000 & 0.0000 & 0.0000 & 0.0000 & 0.0000 & 0.0000 \\ \hline 4.0 & 0.0000 & 0.0000 & 0.0000 & 0.0000 & 0.0000 & 0.0000 & 0.0000 & 0.0000 & 0.0000 & 0.0000 \\ \hline \end{tabular} Question 1 (Network design optimization). [20 points] ABC Limited Corp. has won contracts to supply a high-tech product to customers in Asia, North America, Europe, and South America. The company has determined three potential locations for building its manufacturing plants. The fixed costs of opening a plant at each one of the three potential locations, the variable production costs per unit and the production capacity at each potential plant are shown in the following table: According to the signed contracts, the demand from customers in Asia, North America, Europe, and South America are 13,10,15, and 7 units, respectively. The shipping costs (in $100 per unit) from each potential plant to each customer region are given in the following table: E For notation consistency, use index i=1,2,3 to represent plant locations in Brazil, Philippines, and Mexico, respectively. Similarly, use index j=1,2,3,4 to respectively represent customer regions in Asia, North America, Europe, and South America. (1) Assume that all the demands must be satisfied, and the company needs to determine the optimal facility location decision and demand allocation plan in order to minimize the total production and shipping costs. Please help the firm formulate an optimization model (with linear objective function and Appendix: Standard Normal Distribution Table ( Z table) Appendix: Standard Normal Loss Function Table
Step by Step Solution
There are 3 Steps involved in it

Get step-by-step solutions from verified subject matter experts