

Question: Question 22 (10 points) Continued from the previous question Bass-killer, a special plastic bait, is available at the Winona Fishing Cabin(WFC) at $10 per bag.
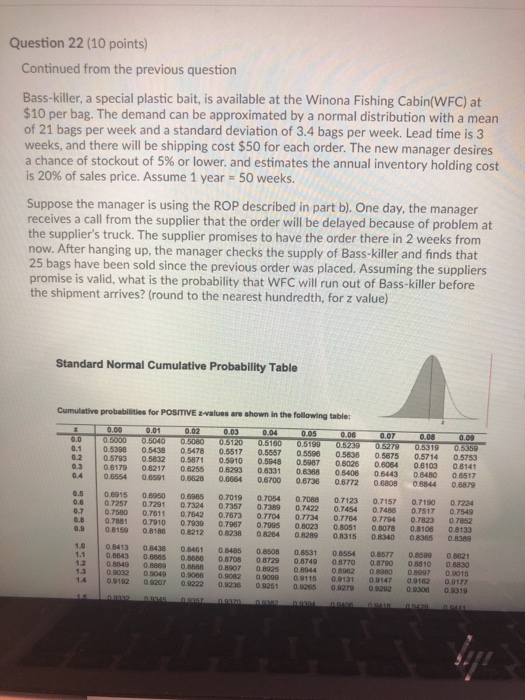
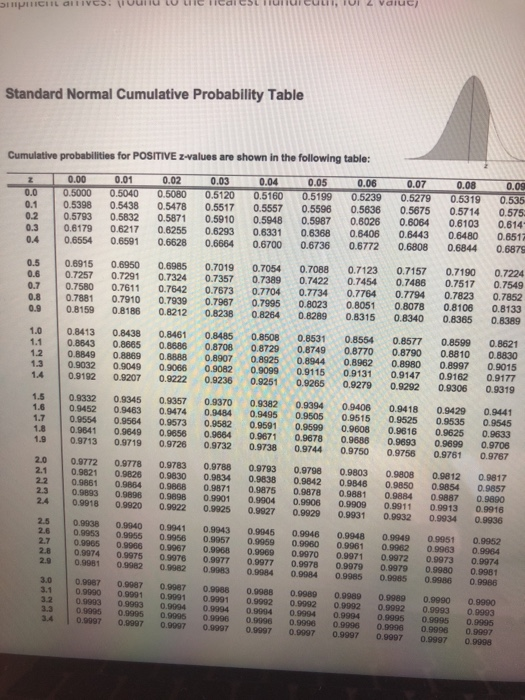
Question 22 (10 points) Continued from the previous question Bass-killer, a special plastic bait, is available at the Winona Fishing Cabin(WFC) at $10 per bag. The demand can be approximated by a normal distribution with a mean of 21 bags per week and a standard deviation of 3.4 bags per week. Lead time is 3 weeks, and there will be shipping cost $50 for each order. The new manager desires a chance of stockout of 5% or lower and estimates the annual inventory holding cost is 20% of sales price. Assume 1 year = 50 weeks. Suppose the manager is using the ROP described in part b). One day, the manager receives a call from the supplier that the order will be delayed because of problem at the supplier's truck. The supplier promises to have the order there in 2 weeks from now. After hanging up, the manager checks the supply of Bass-killer and finds that 25 bags have been sold since the previous order was placed. Assuming the suppliers promise is valid, what is the probability that WFC will run out of Bass-killer before the shipment arrives? (round to the nearest hundredth, for z value) Standard Normal Cumulative Probability Table Cumulative probabilities for POSITIVE values are shown in the following table: 0.00 0.01 0.02 0.03 0.04 0.05 0.06 0. 0 060000 6000000 120 0610005190 0.6230 0.5398 0.5438 0.5478 0.5517 0.5557 0.5598 0.5638 0.5793 5832 0.587 0.5910 598 5987 0.8179 06217 0.6255 0.623 0.8331 0.6358 0.5405 0.6554 0.6501 00028 0.0064 0.5700 0.6736 0.6772 0.07 279 0 5875 0.08 0919 05714 0.00 0950 05753 0.5443 0.6803 0 5480 06844 0.6517 0.5879 0.89150 950 0005 0.7257 07291 07324 0.750 0.7811 0742 0.7681 07910 07030 0.8159 0.8186 0.8212 0.7019 0.7054 0 7357073 0767307704 0.7067 0.7995 0.8238 0.8204 078 07123 07422 07454 0.7734 07754 0.8023 0.8051 08289 0.8315 0.7157 07455 0.774 05078 0.8340 07190 07517 07823 0.8108 0.8365 07224 0.7549 0.7852 0.8133 0.8389 0 01438 03543 0 09 0049 0.91920 9207 0 3461 03585 0 8 0.000 0.0222 0.850 0.1925 9099 0.90 0.002 0.9236 0.8531 08044 0.9115 03554 08577 HD 9 060020 0 02131 0.0147 99 9 9 0.1997 09 9 B 0.9015 DICIL CIVCS. lvui l L licai CSL lluilui culil, IUI 2 Valuci Standard Normal Cumulative Probability Table Cumulative probabilities for POSITIVE z-values are shown in the following table: 0.0 0.1 0.2 0.3 0.00 0.01 0.5000 0.5040 0.5398 0.5438 0.5793 0.5832 0.61790.6217 0.6554 0.6591 0.02 0.5080 0.5478 0.587 0.6255 0.6628 0.03 0.5120 0.5517 0.5910 0.6293 0.6664 0.04 0.5160 0.5557 0.5948 0.6331 0.6700 0.05 0.5199 0.5596 0.5987 0.6368 0.6736 0.06 0.5239 0.5636 0.6026 0.6406 0.6772 0.07 0.5279 0.5675 0.6064 0.6443 0.6808 0.08 0.5319 0.5714 0.6103 0.6480 0.6844 0.09 0.535 0.575 0.614- 0.6517 0.6875 0.4 0.5 0.6915 0.7257 0.7580 0.7881 0.8159 0.6950 0.7291 0.7611 0.7910 0.8186 0.6985 0.7324 0.7642 0.7939 0.8212 0.8 0.7019 0.7357 0.7673 0.7967 0.8238 0.7054 0.7389 0.7704 0.7995 0.8264 0.7088 0.7422 0.7734 0.8023 08289 0.7123 0.7454 0.7764 0.8051 0.8315 0.7157 0.7486 0.7794 0.8078 0.8340 0.7190 0.7517 0.7823 0.8106 0.8365 0.7224 0.7549 0.7852 0.8133 0.8389 0.9 1.0 1.1 1.2 0.84130.8438 0.8843 0.8665 0.8849 0 8.889 0.9032 0.9049 0.9192 0.9207 0.8461 0.8686 0.8.8.88 0.9086 0.9222 0.8486 0.8708 0.8907 0.9082 0.9236 0.8508 0.8729 0.8925 0.9099 0.9251 0.8531 0.8749 0.8944 0.9115 0.9265 0.8554 0.8770 0.8962 0.9131 0.9279 0.8577 0.8790 0.8980 0.9147 0.9292 0.8599 0.8810 0.9997 0.9162 0.9306 0.8621 0.8830 0.9015 0.9177 0.9319 1.6 0.9332 0.9452 0.9554 0 9641 0.9713 0.0345 0.9463 0.9564 0.9649 0.9719 0.9357 0.9474 0.9573 09858 0.9728 0.9370 0.9484 0.9582 0.9884 0.9732 0.9382 0.9495 0.9591 0.9671 0.9738 0.9394 0.9505 0.9599 0.9678 0.9744 0.9406 0.9515 0.9608 0.9686 0.9418 0.9525 0.9616 0.9893 0.9429 0.9535 0.9625 0.9699 0.9441 0.9545 0.9633 0.9706 0.9803 0.9808 22 09812 0.9772 0.9821 0.9861 0.9893 0.9918 0.9778 0.9826 0.9854 0.9896 0.9920 0.9783 0.9830 0.9868 0.9898 0.9922 0.9788 0.9834 0.9871 09901 0.9901 0.9925 0.9793 0.9838 0.9875 0.9904 0.9927 0.9798 0.9842 0.9878 0.9906 0.9929 0.9881 0.9909 0.9931 0.9884 0.9887 0.99110 9913 0.9932 0.9934 0.9817 0.9857 0.9890 0.9916 0.9936 2.5 2.6 2.7 938 0.9953 0.9965 0 9974 0.9981 0.9940 0.9955 09966 0.9975 090R2 0.9941 0.9956 0.9967 0.9978 0.9982 0.9943 09957 0.9968 0.9977 0.9983 0.9945 0.9959 0.9969 0.9977 0.9984 0.9946 0.9960 0.9970 0.9978 0.9984 0.9948 0.9961 0.9971 0.9979 0.9985 0.9949 0.9962 0.9972 0.9979 0.9985 0 9951 0.9963 0.9973 0.9980 0.986 0.9952 0.9984 0.9974 0.9981 0.9986 3.1 09987 0.9087 099900 9991 0.9993 09993 0.9995 0.9995 10.9997 0.9997 09987 0.0088 0.9988 0.9991 09901 0.9992 0.9904 099040 9904 0.99950 9996 9 996 0.9997 0.9997 0.9997 0.9989 0 9989 0.99890 9990 0.99920999209992 0.9993 0 9094 0.9994 09995 0.9995 0.9996 0 9996 0.9996 0.0996 0.9997 0.9997 0.9997 0.9997 0.9990 0 9993 0.0905 0.9997 0.9998
Step by Step Solution
There are 3 Steps involved in it
1 Expert Approved Answer
Step: 1 Unlock

Question Has Been Solved by an Expert!
Get step-by-step solutions from verified subject matter experts
Step: 2 Unlock
Step: 3 Unlock