

Question: Apply exponential smoothing: For Alpha = 0.4 (Column C): In cell C3, type the formula: =B2 (Initialize the forecast with the first GDP value) In
Apply exponential smoothing:
For Alpha = 0.4 (Column C): In cell C3, type the formula: =B2 (Initialize the forecast with the first GDP value) In cell C4, type the formula: =0.4*B3 + (1-0.4)*C3 (Exponential smoothing formula) Drag the formula down to C17
For Alpha = 0.6 (Column D): In cell D3, type the formula: =B2 (Initialize the forecast with the first GDP value) In cell D4, type the formula: =0.6*B3 + (1-0.6)*D3 (Exponential smoothing formula) Drag the formula down to D17
Calculate the mean absolute deviation (MAD):
In column E, starting from E4, calculate the absolute deviation for each forecast using the formula: =ABS(B4-C4) for Alpha=0.4 and =ABS(B4-D4) for Alpha=0.6. Drag these formulas down to E17.
Calculate the mean absolute deviation for each model by averaging the absolute deviations. In cell F2, type the formula: =AVERAGE(E4:E17) and do the same for cell G2.
Compare the MAD values to determine the better model.
Create a scatter chart of the actual GDP data (Years and GDP) and add two line charts for the forecasts (Years and Forecasts) with Alpha=0.4 and Alpha=0.6. Make sure to include proper legends.
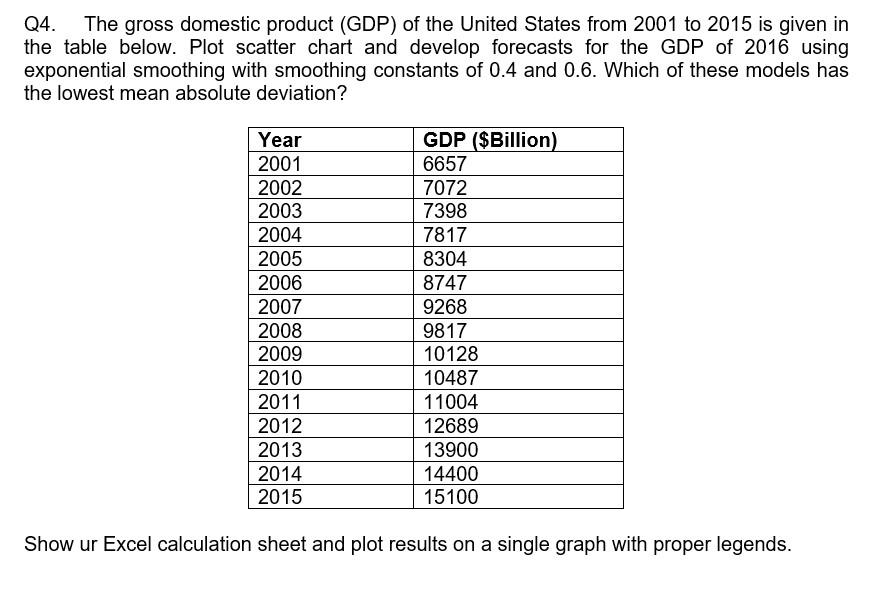
Q4. The gross domestic product (GDP) of the United States from 2001 to 2015 is given in the table below. Plot scatter chart and develop forecasts for the GDP of 2016 using exponential smoothing with smoothing constants of 0.4 and 0.6 . Which of these models has the lowest mean absolute deviation? Show ur Excel calculation sheet and plot results on a single graph with proper legends
Step by Step Solution
There are 3 Steps involved in it

Get step-by-step solutions from verified subject matter experts