

Question: Apply single linkage cluster analysis to Berkeley, Cal Tech, UCLA, and UNC in the Excel file Colleges and Universities Cluster Analysis Worksheet and draw a
Apply single linkage cluster analysis to Berkeley, Cal Tech, UCLA, and UNC in the Excel file Colleges and Universities Cluster Analysis Worksheet and draw a dendrogram illustrating the clustering process.
Data provided:
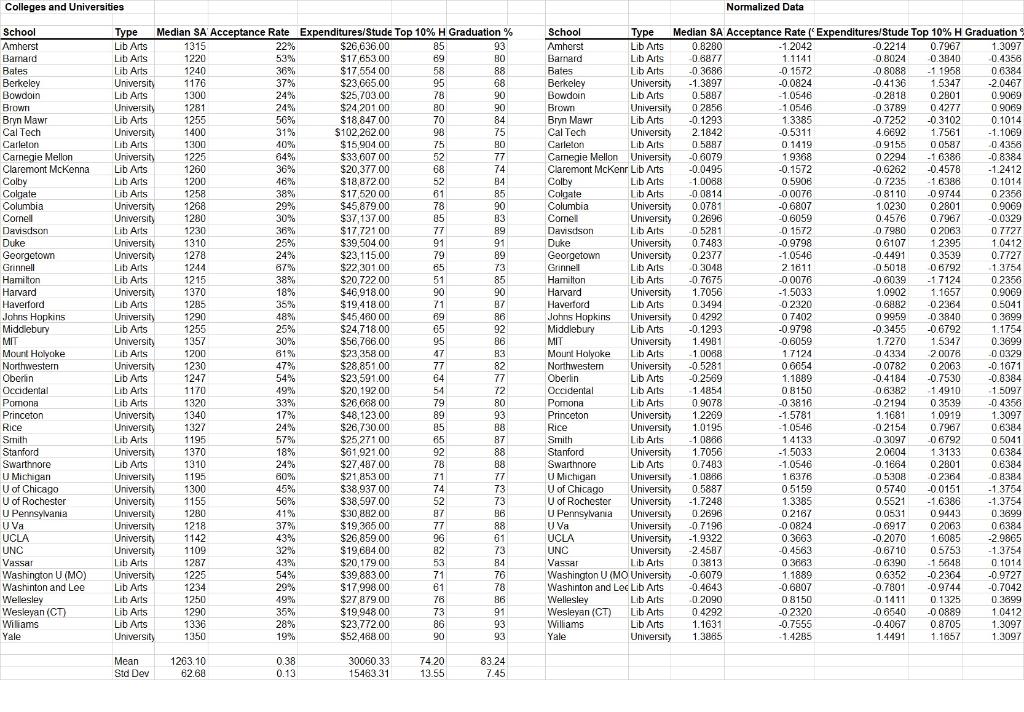
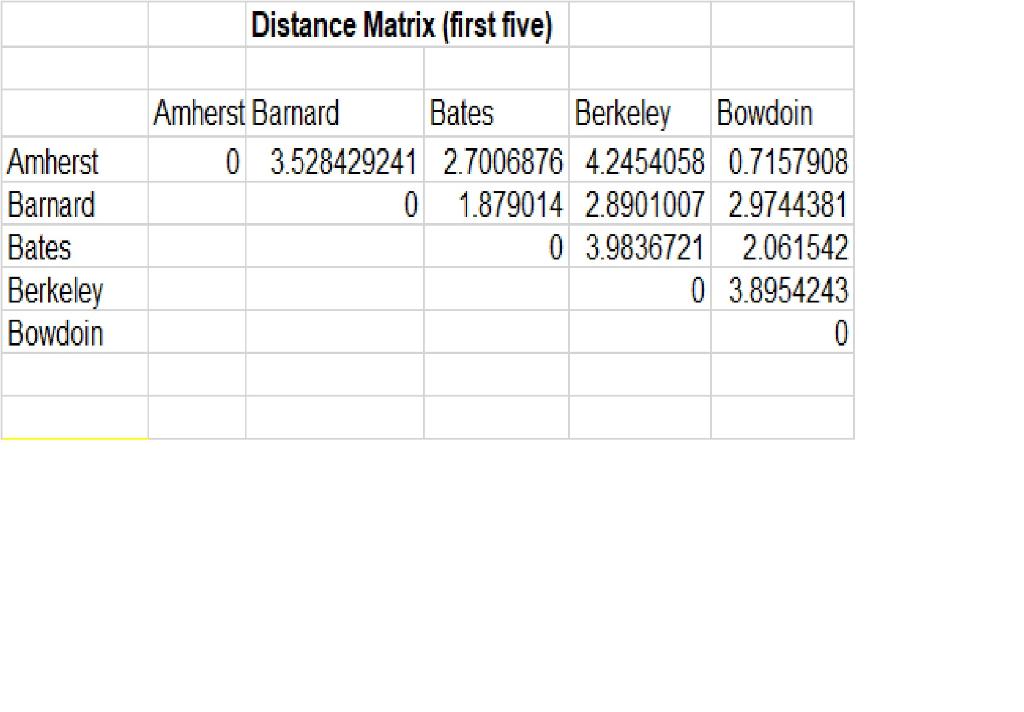
Colleges and Universities Normalized Data Distance Matrix (first five) \begin{tabular}{|l|r|r|r|r|r|} \hline & Amherst Barnard & \multicolumn{1}{l}{ Bates } & \multicolumn{1}{l|}{ Berkeley } & \multicolumn{1}{l|}{ Bowdoin } \\ \hline Amherst & 0 & 3.528429241 & 2.7006876 & 4.2454058 & 0.7157908 \\ \hline Barnard & & 0 & 1.879014 & 2.8901007 & 2.9744381 \\ \hline Bates & & & 0 & 3.9836721 & 2.061542 \\ \hline Berkeley & & & & 0 & 3.8954243 \\ \hline Bowdoin & & & & & 0 \\ \hline \end{tabular}
Step by Step Solution
There are 3 Steps involved in it

Get step-by-step solutions from verified subject matter experts