

Question: are you interpret this report ? B C D E 1 2017 323,579 576,679 670,034 Ratio Analysis 2 Sales Revenue 3 Cost of Sales(-) 4.
 are you interpret this report ?
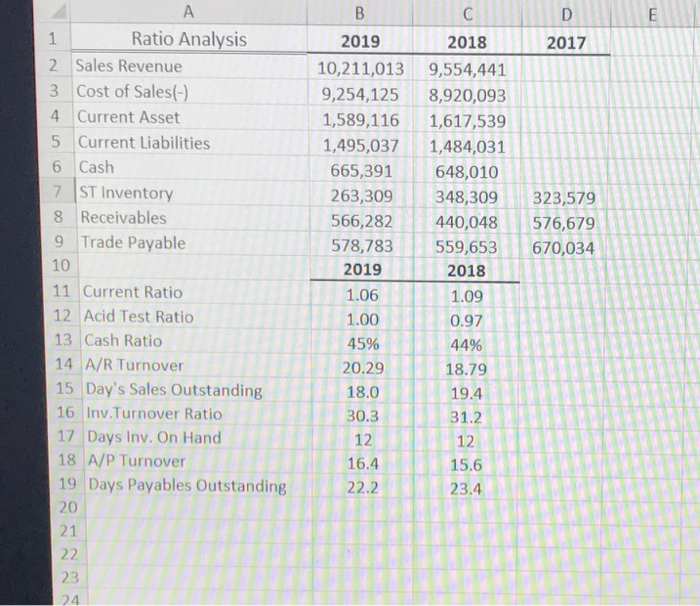
B C D E 1 2017 323,579 576,679 670,034 Ratio Analysis 2 Sales Revenue 3 Cost of Sales(-) 4. Current Asset 5 Current Liabilities 6 Cash 7 ST Inventory 8 Receivables 9 Trade Payable 10 11 Current Ratio 12 Acid Test Ratio 13 Cash Ratio 14 A/R Turnover 15 Day's Sales Outstanding 16 Inv.Turnover Ratio 17 Days Inv. On Hand 18 A/P Turnover 19 Days Payables Outstanding 20 21 22 23 24 2019 2018 10,211,013 9,554,441 9,254,125 8,920,093 1,589,116 1,617,539 1,495,037 1,484,031 665,391 648,010 263,309 348,309 566,282 440,048 578,783 559,653 2019 2018 1.06 1.09 1.00 0.97 45% 44% 20.29 18.79 18.0 19.4 30.3 31.2 12 12 16.4 15.6 22.2 23.4
Step by Step Solution
There are 3 Steps involved in it

Get step-by-step solutions from verified subject matter experts