

Question: As your boss is not interested in sorting through data on a spreadsheet, you will then write up a professional report summarizing your findings. This
As your boss is not interested in sorting through data on a spreadsheet, you will then write up a professional report summarizing your findings. This report should include your scatterplot graph and any necessary tables. Within your report, in addition to any appropriate introductions, conclusions, citations, etc. also discuss the following:
? Interpret the correlation coefficient.
? Discuss the hypothesis in order to determine whether the population correlation between the two variables differs from zero.
? What are the results of the hypothesis test in the context of this task (at the 5% significance level)?
? What is the sample regression equation that could enable your to predict property taxes on the basis of the size of a home?
? Using this, predict the property taxes for a home that is 1,500 square ft.
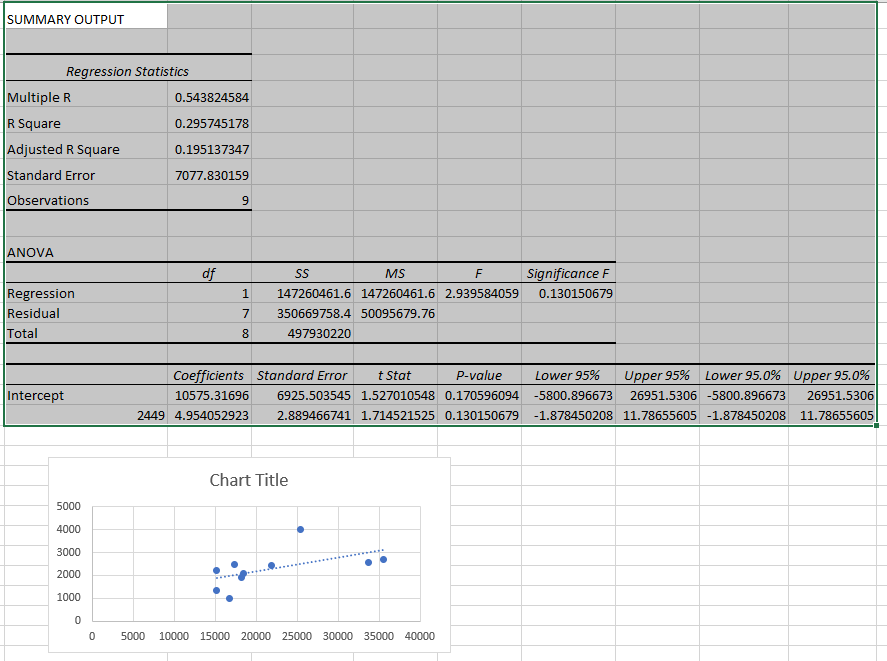
SUMMARY OUTPUT Regression Statistics Multiple R 0.543824584 R Square 0.295745178 Adjusted R Square 0.195137347 Standard Error 7077.830159 Observations 9 ANOVA df SS MS F Significance F Regression 1 147260461.6 147260461.6 2.939584059 0.130150679 Residual 350669758.4 50095679.76 Total 8 497930220 Coefficients |Standard Error t Stat P-value Lower 95% Upper 95% Lower 95.0% Upper 95.0% Intercept 10575.31696 6925.503545 1.527010548 0.170596094 -5800.896673 26951.5306 -5800.896673 26951.5306 2449 4.954052923 2.889466741 1.714521525 0.130150679 -1.878450208 11.78655605 -1.878450208 11.78655605 Chart Title 5000 4000 3000 2000 1000 0 5000 10000 15000 20000 25000 30000 35000 40000
Step by Step Solution
There are 3 Steps involved in it

Get step-by-step solutions from verified subject matter experts