

Question: ASAP Below are the mean and range values for 6 samples, which were used to compute the control limits for a process. If the lower
ASAP 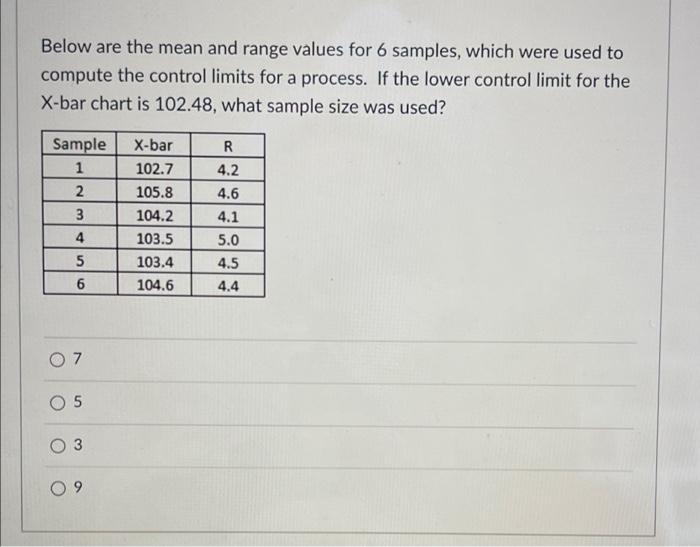
Below are the mean and range values for 6 samples, which were used to compute the control limits for a process. If the lower control limit for the X-bar chart is 102.48, what sample size was used? Sample 1 2 3 4 X-bar 102.7 105.8 104.2 103.5 103.4 104.6 R 4.2 4.6 4.1 5.0 4.5 4.4 5 6 07 05 3 9
Step by Step Solution
There are 3 Steps involved in it
1 Expert Approved Answer
Step: 1 Unlock

Question Has Been Solved by an Expert!
Get step-by-step solutions from verified subject matter experts
Step: 2 Unlock
Step: 3 Unlock