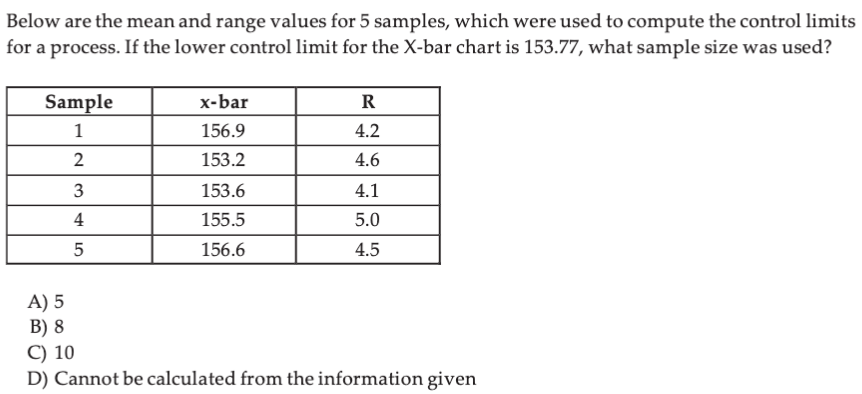
Question: I NEED AN ANSWER QUICK! I WILL THUMBS UP/LIKE! Below are the mean and range values for 5 samples, which were used to compute the

I NEED AN ANSWER QUICK! I WILL THUMBS UP/LIKE!

I NEED AN ANSWER QUICK! I WILL THUMBS UP/LIKE!

Below are the mean and range values for 5 samples, which were used to compute the control limits for a process. If the lower control limit for the X-bar chart is 153.77, what sample size was used? Sample 1 R 4.2 2 4.6 x-bar 156.9 153.2 153.6 155.5 156.6 3 4 5 4.1 5.0 4.5 A) 5 B) 8 C) 10 D) Cannot be calculated from the information given

Step by Step Solution

There are 3 Steps involved in it

1 Expert Approved Answer
Step: 1 Unlock blur-text-image
Question Has Been Solved by an Expert!

Get step-by-step solutions from verified subject matter experts

Step: 2 Unlock
Step: 3 Unlock

Students Have Also Explored These Related General Management Questions!