

Question: asap please . and please do both A and B . and the down below i have uploaded the excel data . thank you excel
asap please .
and please do both A and B .
and the down below i have uploaded the excel data .
thank you 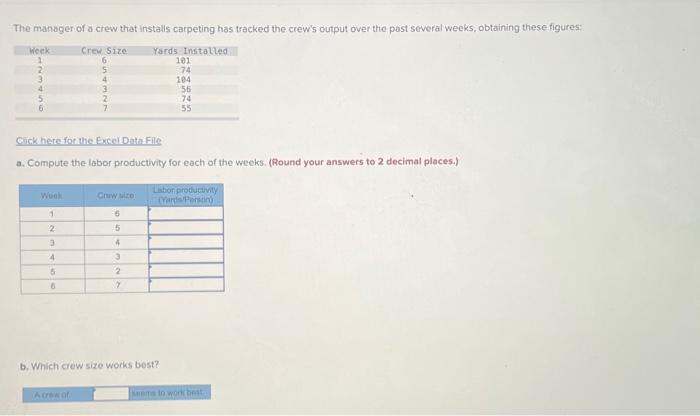
 excel data file
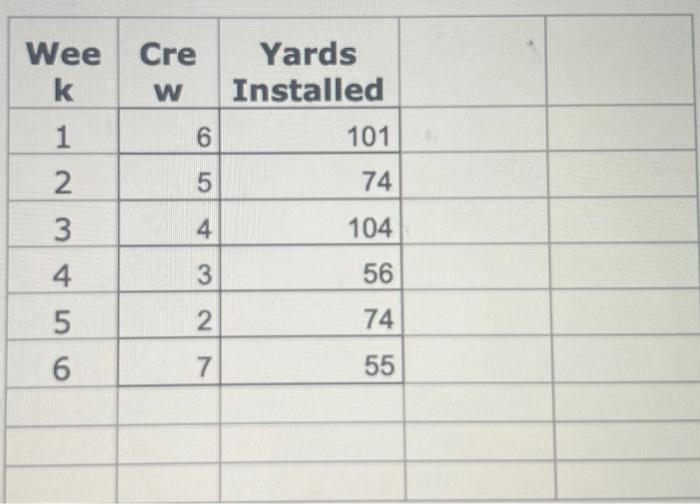
 The manager of a crew that installs carpeting has tracked the crew's output over the past several weeks, obtaining these figures: Cick herefor the Excel Dath File - Compute the iabor productivity for each of the weeks. (Round your answers to 2 decimal places.) b. Which crew size works best? \begin{tabular}{|c|r|r|} \hline \begin{tabular}{c} Wee \\ k \end{tabular} & \begin{tabular}{c} Cre \\ W \end{tabular} & \begin{tabular}{c} Yards \\ Installed \end{tabular} \\ \hline 1 & 6 & 101 \\ \hline 2 & 5 & 74 \\ \hline 3 & 4 & 104 \\ \hline 4 & 3 & 56 \\ \hline 5 & 2 & 74 \\ \hline 6 & 7 & 55 \\ \hline \end{tabular}
Step by Step Solution
There are 3 Steps involved in it
1 Expert Approved Answer
Step: 1 Unlock

Question Has Been Solved by an Expert!
Get step-by-step solutions from verified subject matter experts
Step: 2 Unlock
Step: 3 Unlock