

Question: Assignment 1. Using the data in Table 8.8, what is the average per centage of infections? 2. Construct an appropriate control chart, compute the upper
Assignment
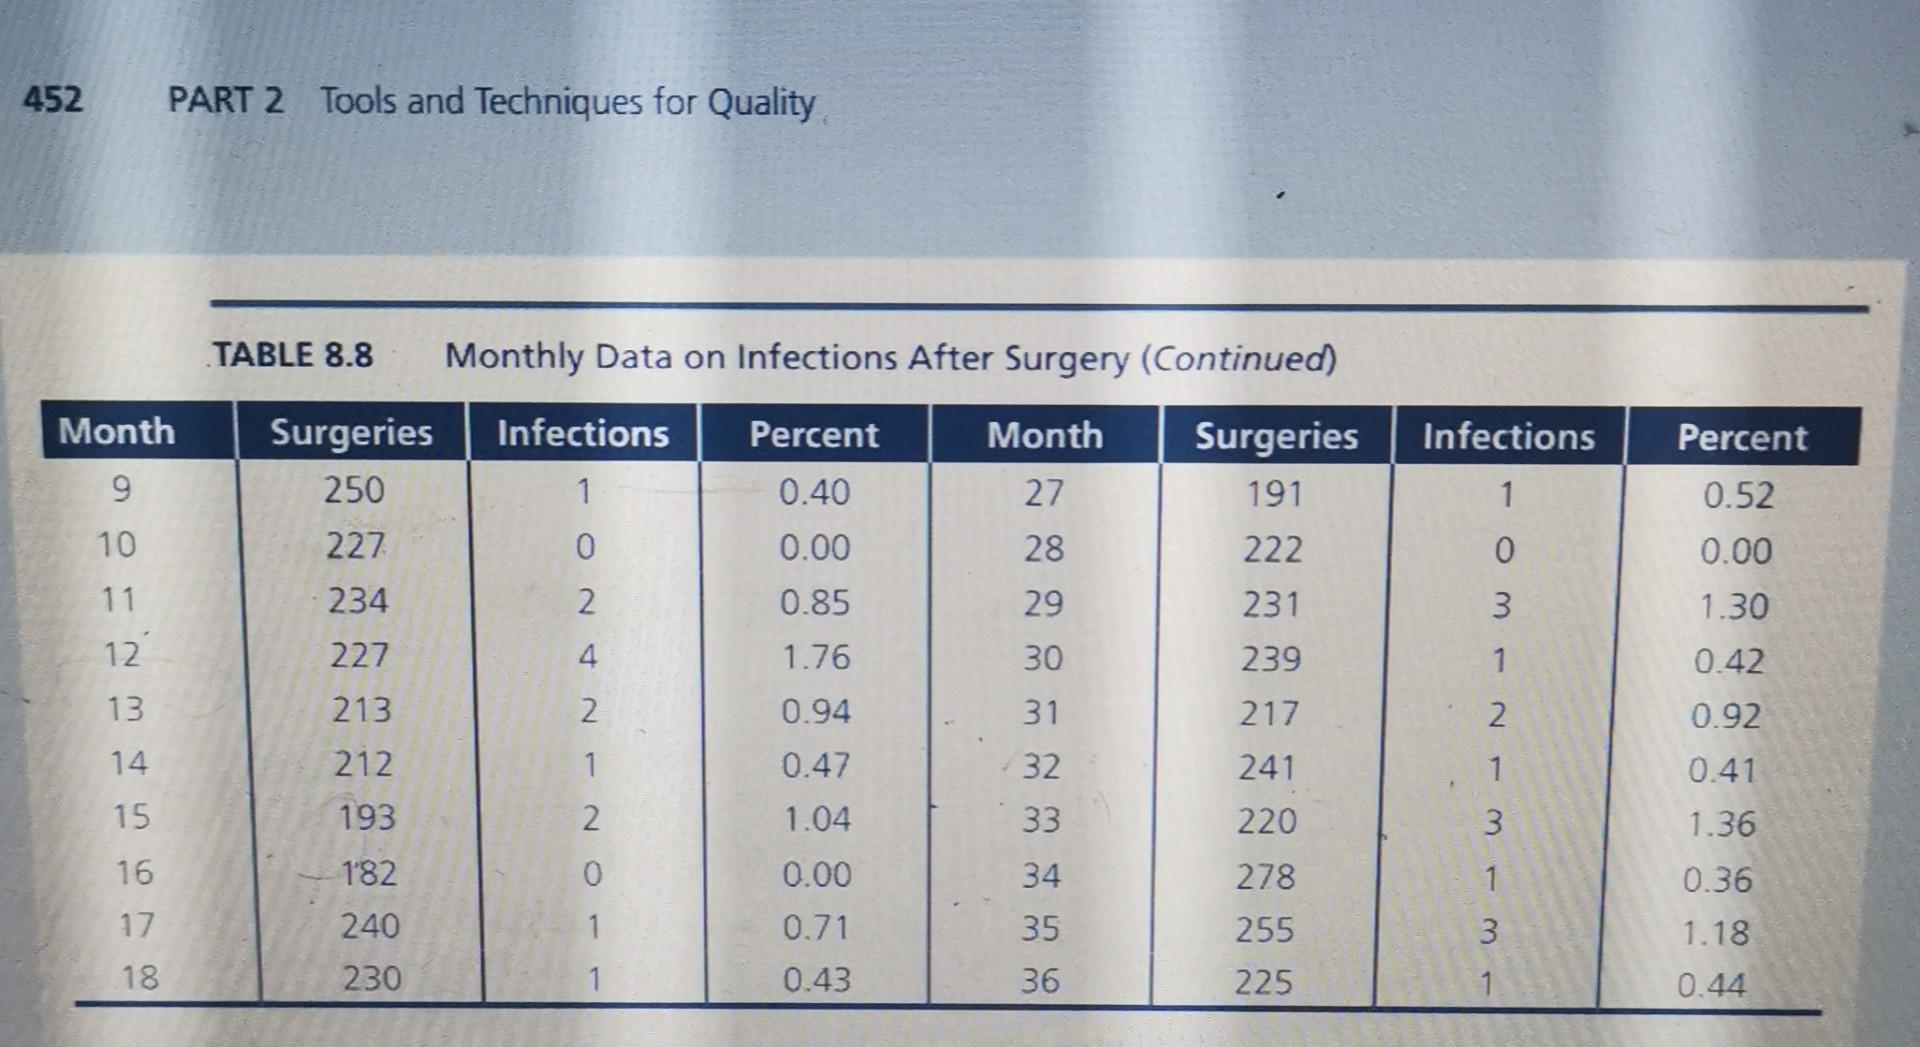
1. Using the data in Table 8.8, what is the average per centage of infections?
2. Construct an appropriate control chart, compute the upper and lower control limits, plot the data on a control chart, and determine if the process is in sta tistical control. Based on your analysis, what action, if any, should management take?
3. What TFE should management use to monitor future data?
( kindly answer it in details with equation need and full reliable answers)
452 PART 2 Tools and Techniques for Quality TABLE 8.8 Monthly Data on Infections After Surgery (Continued) Month Infections Month Infections Percent Surgeries 250 9 1 27 1 0.52 Surgeries 191 222 231 10 227 Percent 0.40 0.00 0.85 1.76 0 28 0.00 11 234 2 29 3 1.30 12 227 4 30 239 0.42 13 213 2 31 217 2 0.92 14. 212 1 0.94 0.47 1.04 32 241 0.41 15 193 2 33 220 3 1.36 16 182 0 0.00 34 4 278 255 17 1 240 230 www 3 0.71 0.43 35 36 0.36 1.18 0.44 18 1 225Step by Step Solution
There are 3 Steps involved in it
1 Expert Approved Answer
Step: 1 Unlock

Question Has Been Solved by an Expert!
Get step-by-step solutions from verified subject matter experts
Step: 2 Unlock
Step: 3 Unlock