

Question: Assignment 3 Assignment 3: Data Analysis with Graphs Assignment Data Set A Data Set B Masses, to the nearest kilogram, of 30 Times, in seconds,
Assignment 3
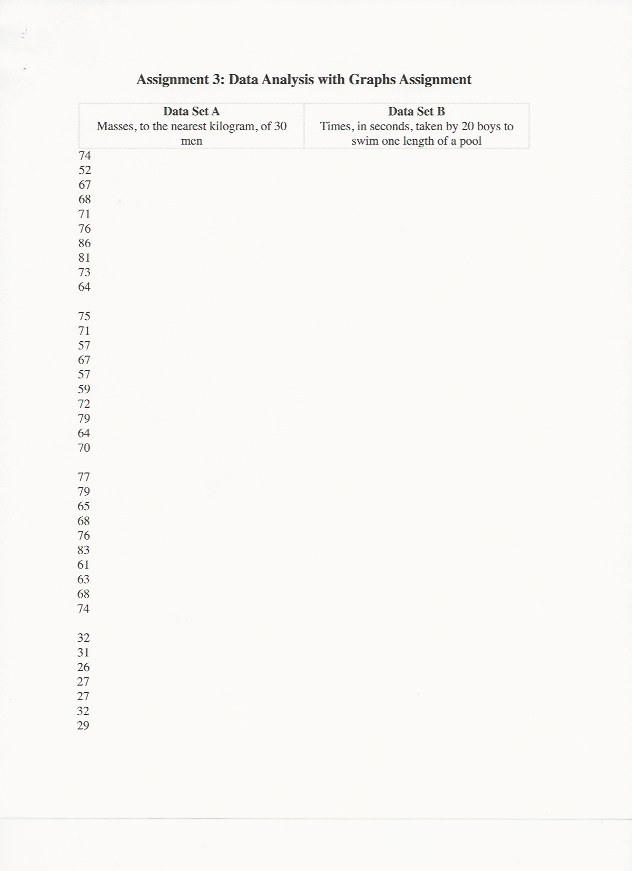
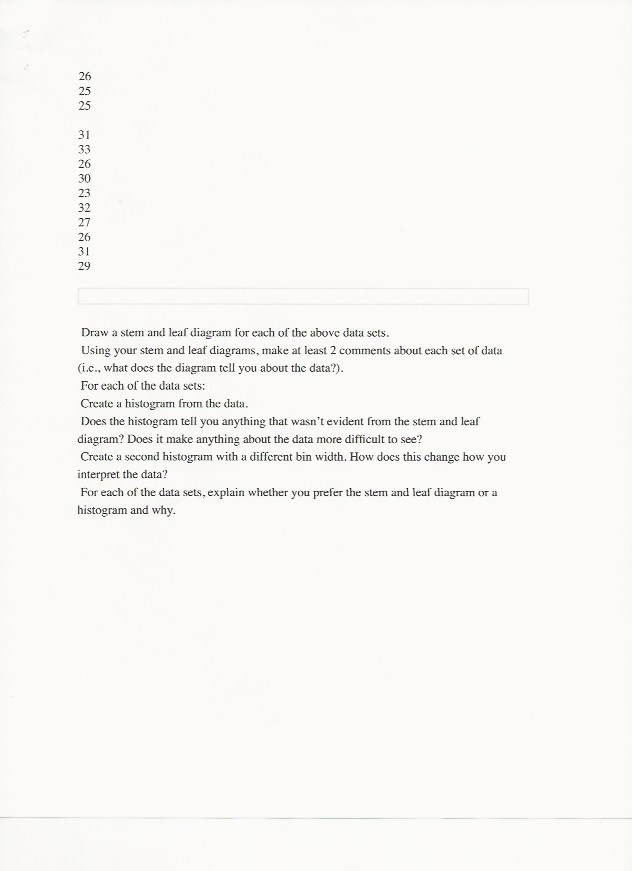
Assignment 3: Data Analysis with Graphs Assignment Data Set A Data Set B Masses, to the nearest kilogram, of 30 Times, in seconds, taken by 20 boys to men swim one length of a pool 74 52 67 68 71 76 86 81 73 6426 31 26 23 27 26 31 29 Draw a stem and leaf diagram for each of the above data sets. Using your stem and leaf diagrams, make at least 2 comments about each set of data (i.c., what does the diagram tell you about the data?). For each of the data sets: Create a histogram from the data. Does the histogram tell you anything that wasn't evident from the stem and leaf diagram? Does it make anything about the data more difficult to see? Create a second histogram with a different bin width. How does this change how you interpret the data? For each of the data sets, explain whether you prefer the stem and leaf diagram or a histogram and why
Step by Step Solution
There are 3 Steps involved in it

Get step-by-step solutions from verified subject matter experts