Question: Assignment #3: Data Analysis and Visualization In this assignment, you will design a visualization for a dataset. You are free to use any graphics or
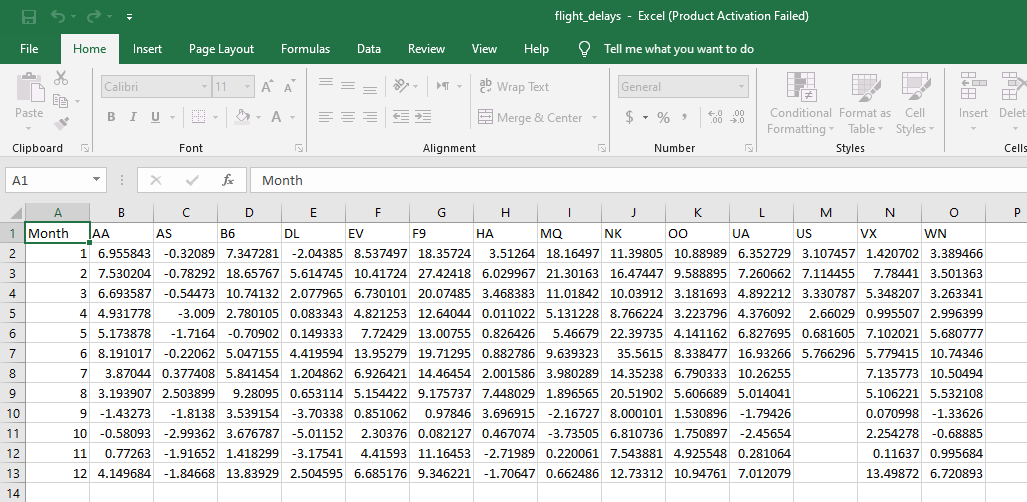
Assignment #3: Data Analysis and Visualization In this assignment, you will design a visualization for a dataset. You are free to use any graphics or charting tool you please -including drafting it by hand. Data Set: Flight Delays The U.S. Department of Transportation tracks the performance of domestic flights operated by air carriers. Summary information on the number of on-time, delayed, canceled, and diverted flights is published for 2015. Each entry shows the average arrival delay in minutes) for a different airline and month. Negative entries denote flights that (on average) tended to arrive early. For instance, the average American Airlines flight (airline code: AA) in January arrived roughly 7 minutes late, and the average Alaska Airlines flight (airline code: AS) in April arrived roughly 3 minutes early. Download the dataset: attached see [flight_delays.csv] Assignment Your task is to design a visualization that you believe effectively communicates the data and provide a short write-up (2 to 4 paragraphs) describing your design. Start by choosing a question you'd like your visualization to answer. Design your visualization to answer that question, and use the question as the title of your graphic. Examples of questions: Does the seasons (e.g., winter) impact the flight delays? Is there a relationship between airlines in terms of flight delays? Note that you are free to transform the data as you see fit. Such transforms may include (but are not limited to) log transformation, computing percentages or averages, grouping elements into new categories, or removing unnecessary variables or records. You are also free to incorporate external data as you see fit. Your chart image should be interpretable without recourse to your short write-up. Do not forget to include title, axis labels or legends as needed! Grading The assignment score is out of a maximum of 10 points. I will determine scores by judging both the soundness of your design (e.g., in accordance with the expressiveness and effectiveness principles) and the quality of the write-up. Here are examples of aspects that may lead to point deductions: Use of misleading, unnecessary, or unmotivated graphic elements. Missing chart title, axis labels, or data transformation description. Ineffective encodings for your stated goal (e.g., distracting colors, improper data transformation). Submission Details Question No. Grade Attained Marks 10 10 Produce effective graphics Chart title, axis labels, or data transformation description. Effective encodings for your stated goal (e.g., reasonable colors). Demonstrating exceptional creativity, or effective annotations or other narrative devices. 10 10 Total Avg flight_delays - Excel (Product Activation Failed) File Home Insert Page Layout Formulas Data Review View Help Tell me what you want to do Calibri - 11 A ap Wrap Text General FH FH Insert Delet Paste BIU- -A- E Merge & Center $ % .00 .000 Conditional Format as Cell Formatting Table Styles Styles Clipboard Font Alignment Number Cells A1 X f Month P B D E F G H 1 J K L M N o 1 Month IAA AS B6 DL EV F9 HA MQ NK 00 UA US VX WN 2 1 6.955843 -0.32089 7.347281 -2.04385 8.537497 18.35724 3.51264 18.16497 11.39805 10.88989 6.352729 3.107457 1.420702 3.389466 3 2 7.530204 -0.78292 18.65767 5.614745 10.41724 27.42418 6.029967 21.30163 16.47447 9.588895 7.260662 7.114455 7.78441 3.501363 4 3 6.693587 -0.54473 10.74132 2.077965 6.730101 20.07485 3.468383 11.01842 10.03912 3.181693 4.892212 3.330787 5.348207 3.263341 5 4 4.931778 -3.009 2.780105 0.083343 4.821253 12.64044 0.011022 5.131228 8.766224 3.223796 4.376092 2.66029 0.995507 2.996399 6 5 5.173878 -1.7164 -0.70902 0.149333 7.72429 13.00755 0.826426 5.46679 22.39735 4.141162 6.827695 0.681605 7.102021 5.680777 7 6 8.191017 -0.22062 5.047155 4.419594 13.95279 19.71295 0.882786 9.639323 35.5615 8.338477 16.93266 5.766296 5.779415 10.74346 8 7 3.87044 0.377408 5.841454 1.204862 6.926421 14.46454 2.001586 3.980289 14.35238 6.790333 10.26255 7.135773 10.50494 9 8 3.193907 2.503899 9.28095 0.653114 5.154422 9.175737 7.448029 1.896565 20.51902 5.606689 5.014041 5.106221 5.532108 10 9 -1.43273 -1.8138 3.539154 -3.70338 0.851062 0.97846 3.696915 -2.16727 8.000101 1.530896 -1.79426 0.070998 -1.33626 11 10 -0.58093 -2.99362 3.676787 -5.01152 2.30376 0.082127 0.467074 -3.73505 6.810736 1.750897 -2.45654 2.254278 -0.68885 12 11 0.77263 -1.91652 1.418299 -3.17541 4.41593 11.16453 -2.71989 0.220061 7.543881 4.925548 0.281064 0.11637 0.995684 13 12 4.149684 -1.84668 13.83929 2.504595 6.685176 9.346221 -1.70647 0.662486 12.73312 10.94761 7.012079 13.49872 6.720893 14 Assignment #3: Data Analysis and Visualization In this assignment, you will design a visualization for a dataset. You are free to use any graphics or charting tool you please -including drafting it by hand. Data Set: Flight Delays The U.S. Department of Transportation tracks the performance of domestic flights operated by air carriers. Summary information on the number of on-time, delayed, canceled, and diverted flights is published for 2015. Each entry shows the average arrival delay in minutes) for a different airline and month. Negative entries denote flights that (on average) tended to arrive early. For instance, the average American Airlines flight (airline code: AA) in January arrived roughly 7 minutes late, and the average Alaska Airlines flight (airline code: AS) in April arrived roughly 3 minutes early. Download the dataset: attached see [flight_delays.csv] Assignment Your task is to design a visualization that you believe effectively communicates the data and provide a short write-up (2 to 4 paragraphs) describing your design. Start by choosing a question you'd like your visualization to answer. Design your visualization to answer that question, and use the question as the title of your graphic. Examples of questions: Does the seasons (e.g., winter) impact the flight delays? Is there a relationship between airlines in terms of flight delays? Note that you are free to transform the data as you see fit. Such transforms may include (but are not limited to) log transformation, computing percentages or averages, grouping elements into new categories, or removing unnecessary variables or records. You are also free to incorporate external data as you see fit. Your chart image should be interpretable without recourse to your short write-up. Do not forget to include title, axis labels or legends as needed! Grading The assignment score is out of a maximum of 10 points. I will determine scores by judging both the soundness of your design (e.g., in accordance with the expressiveness and effectiveness principles) and the quality of the write-up. Here are examples of aspects that may lead to point deductions: Use of misleading, unnecessary, or unmotivated graphic elements. Missing chart title, axis labels, or data transformation description. Ineffective encodings for your stated goal (e.g., distracting colors, improper data transformation). Submission Details Question No. Grade Attained Marks 10 10 Produce effective graphics Chart title, axis labels, or data transformation description. Effective encodings for your stated goal (e.g., reasonable colors). Demonstrating exceptional creativity, or effective annotations or other narrative devices. 10 10 Total Avg flight_delays - Excel (Product Activation Failed) File Home Insert Page Layout Formulas Data Review View Help Tell me what you want to do Calibri - 11 A ap Wrap Text General FH FH Insert Delet Paste BIU- -A- E Merge & Center $ % .00 .000 Conditional Format as Cell Formatting Table Styles Styles Clipboard Font Alignment Number Cells A1 X f Month P B D E F G H 1 J K L M N o 1 Month IAA AS B6 DL EV F9 HA MQ NK 00 UA US VX WN 2 1 6.955843 -0.32089 7.347281 -2.04385 8.537497 18.35724 3.51264 18.16497 11.39805 10.88989 6.352729 3.107457 1.420702 3.389466 3 2 7.530204 -0.78292 18.65767 5.614745 10.41724 27.42418 6.029967 21.30163 16.47447 9.588895 7.260662 7.114455 7.78441 3.501363 4 3 6.693587 -0.54473 10.74132 2.077965 6.730101 20.07485 3.468383 11.01842 10.03912 3.181693 4.892212 3.330787 5.348207 3.263341 5 4 4.931778 -3.009 2.780105 0.083343 4.821253 12.64044 0.011022 5.131228 8.766224 3.223796 4.376092 2.66029 0.995507 2.996399 6 5 5.173878 -1.7164 -0.70902 0.149333 7.72429 13.00755 0.826426 5.46679 22.39735 4.141162 6.827695 0.681605 7.102021 5.680777 7 6 8.191017 -0.22062 5.047155 4.419594 13.95279 19.71295 0.882786 9.639323 35.5615 8.338477 16.93266 5.766296 5.779415 10.74346 8 7 3.87044 0.377408 5.841454 1.204862 6.926421 14.46454 2.001586 3.980289 14.35238 6.790333 10.26255 7.135773 10.50494 9 8 3.193907 2.503899 9.28095 0.653114 5.154422 9.175737 7.448029 1.896565 20.51902 5.606689 5.014041 5.106221 5.532108 10 9 -1.43273 -1.8138 3.539154 -3.70338 0.851062 0.97846 3.696915 -2.16727 8.000101 1.530896 -1.79426 0.070998 -1.33626 11 10 -0.58093 -2.99362 3.676787 -5.01152 2.30376 0.082127 0.467074 -3.73505 6.810736 1.750897 -2.45654 2.254278 -0.68885 12 11 0.77263 -1.91652 1.418299 -3.17541 4.41593 11.16453 -2.71989 0.220061 7.543881 4.925548 0.281064 0.11637 0.995684 13 12 4.149684 -1.84668 13.83929 2.504595 6.685176 9.346221 -1.70647 0.662486 12.73312 10.94761 7.012079 13.49872 6.720893 14


